
Nothing discussed/written should be considered as investment advice. Please do your own research or speak to a financial advisor before putting a dime of your money into these crazy markets. In other words, if you buy something I bought, you deserve to lose your money.
The only reason why I am making my portfolio public because it provides accountability to me. Some or all the analysis I provide could be from the top of my head and should not be considered accurate.
My investing goal is simple; to try to manage risk while being fully invested without market timing. Howard Marks said it best, “even though we can’t predict, we can prepare.”
All my references to the Market are only for the US Market.
Performance
From Q2 to Q3 I am down 2% (SPY was up 2.3%).
| Year | Me | SPY |
| 2020 | 21.30% | 18.37% |
| 2021 | 27.50% | 16.40% |
Where We Are Now
The best movie I’ve seen this year is Empty Man (its free for HBO Max subscribers). In the beginning four hikers have to cross rickety bridge in order to continue their hike. That’s how I feel the markets are now. In other words, in order to have enough money for retirement or financial independence I have to cross this rickety bridge.
What’s different between October 2021 and March of 2020 is the condition of the bridge. In March the bridge was sturdy because I was buying Berkshire, Markel, Carriage Services, Schwab and Micron at extremely favorable prices. When Meb Faber, Jeremy Grantham, Tobias Carlisle, Jess Felder, John Hussman, Michael Burry and other OG’s say the Market is overheated it’s difficult not sell a lot of my gains and have a higher position than I currently have (its currently 3.1%).
I recently came across this blog post by Jesse Livermore. He argues that percentage of stocks in all of investors portfolios is the greatest predictor of how hot the Market is. You can view the chart below (via FRED).
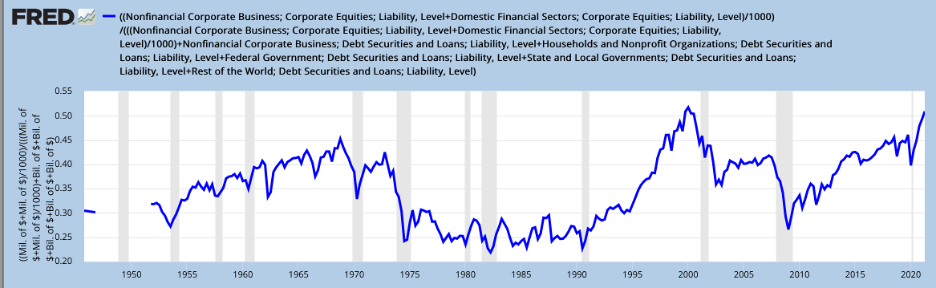
I absolutely love his article. Bubbles aren’t born with people calculating their rate of return or considering their risk tolerance; bubbles are born out of speculation. People see people making a lot of money and they want to jump in. When too many people are speculating the Market becomes a game of musical chairs because eventually there are less people willing to buy and hold stocks.
The FRED chart shows we’re almost at the peak of 2000. I can see a scenario where we’re at/near the peak of the bubble and the Market crashes like it did in the early 2000s. I can also see the continuation of a grinding, low growing bull market that we’ve experienced since 2009.
The average PE multiple for the past 31 years is 22.6 (excluding 2009). We’re currently at about 34, which is about one and half standard deviations from the mean. Using this information alone you can come to the conclusion that the Market is not in a bubble; it’s overheated but not a bubble.
There are two ways to interrupt what I’ve written so far. One is this is a typical late cycle talking point that is said right before the Market blows up. The other is the grinding bull market thesis is directionally correct; we’ll have corrections/minor speed bumps going forward but the Market grind upward. Whatever scenario occurs people will say they always knew which interpretation was correct in hindsight.
I currently believe we’re going to have a continuation of the grinding bull market. Ken Fisher has said for Market collapse to occur something really big that isn’t pre-priced in the Market has to happen. Inflation is top of mind in the financial media. My question is 3-5% inflation already pre-priced because the Market is constantly pre-pricing known information. Also, if you think a collapse is going to occur you have to assume the Federal Reserve and its printing press will not intervene. The Federal Reserve bought bond ETFs in 2020, which at the time was unheard of. What makes you think they won’t do something unheard during the next recession?
This is how I feel about my portfolio. I tried to implement a barbell approach to my portfolio. I think a valid criticism is I lean too much on the defensive side. Like most people I don’t like risk so the fact I haven’t trimmed my biggest position, which on paper right now, is a money losing company indicates I’m willing to let this position run.
I think my portfolio is relatively diversified (Chris Cole would probably say otherwise but that said, I am fan of the Dragon Portfolio. His work is the reason why I hold physical precious metals and bought farmland). What portfolio lacks is trend following. I think whatever new money I add to my account I should incorporate trend following.
This is how I’m managing my cash. I’ll make my annual contribution to my IRA next year but I am not planning to add any more money to the Market this year or next year. Other than my house I have no debt and my mortgage rate is 2.50%. I am going to hold more cash going forward for two purposes.
- My car, which is paid off, is relatively old and I want to have cash available for a new used car
- If I find a security that is a screaming buy I’ll have the cash to make a purchase
In other words, I have my opinion but its weakly held.
Portfolio Update/Activity
I sold all my shares Brighthouse Financial to buy shares in Alibaba and Tencent. I’m currently evaluating a potential third Chinese company. In regards to China as a whole, I think investors are too worried about China’s control on the economy and their corporations within it. I don’t have a massive amount of confidence in my China opinion but the prices I paid makes the best worthwhile and the bets are so small I can live with those investments going to zero.
I’m giving all my Chinese investments at least a year before I think about pressing the sell button. I honestly wanted to say two years instead of one, but if the stocks revert back to where they were a few months ago it would be difficult for me to not sell or trim the positions.
The table below is a breakdown of my portfolio on September 30, 2021 after the close. What you see below where my entire net worth, excluding my home, is allocated. Lastly, my 401k is 100% invested in a Small Cap Value Fund.
| Company | % |
| PLXP | 12.4% |
| BRK.B | 9.9% |
| MU | 8.9% |
| MKL | 6.4% |
| BAC | 5.9% |
| SCHW | 3.3% |
| MO | 3.2% |
| MMP | 3.1% |
| GVAL | 2.2% |
| EPD | 2.1% |
| AIMFF | 2.1% |
| HII | 1.8% |
| OGZPY | 1.8% |
| ZIG | 1.7% |
| GLRE | 1.7% |
| EQC | 1.6% |
| BABA | 1.5% |
| GD | 1.4% |
| NOC | 1.4% |
| NEM | 1.4% |
| ERUS | 1.2% |
| KGC | 1.1% |
| XOM | 0.9% |
| LMT | 0.9% |
| SMIT | 0.8% |
| TCEHY | 0.8% |
| PREKF | 0.8% |
| CVX | 0.7% |
| EPOL | 0.5% |
| FNDC | 0.4% |
| RTX | 0.4% |
| FRFHF | 0.4% |
| FFXXF | 0.2% |
| EWUS | 0.1% |
| FPI | 0.0% |
| LAND | 0.0% |
| ACGBY | 0.0% |
| SRMLF | 0.0% |
| Gold | 2.8% |
| Platinum | 0.7% |
| Farmland | 3.8% |
| I Bonds | 3.6% |
| Cash | 3.0% |
| 401k | 3.3% |
Below is a breakdown by category:
| Bonds | 3.6% |
| Cash | 3.0% |
| Conglomerate | 9.9% |
| Defense | 5.9% |
| Financials | 9.1% |
| Insurance | 6.8% |
| International | 7.0% |
| Manager | 6.3% |
| Oil/Gas | 9.4% |
| Other | 3.2% |
| Pharma | 12.4% |
| Precious Metals | 5.9% |
| Real Estate | 5.5% |
| Semiconductor | 8.9% |
| Small Value | 3.3% |


