
Disclaimer
Nothing discussed/written should be considered as investment advice. Please do your own research or speak to a financial advisor before putting a dime of your money into these crazy markets. In other words, if you buy something I bought, you deserve to lose your money.
The only reason why I am making my portfolio public because it provides accountability to me. Some or all the analysis I provide could be from the top of my head and should not be considered accurate.
My investing goal is simple; to try to manage risk while being fully invested without market timing. Howard Marks said it best, “even though we can’t predict, we can prepare.”
All my references to the Market are only for the US Market.
Performance
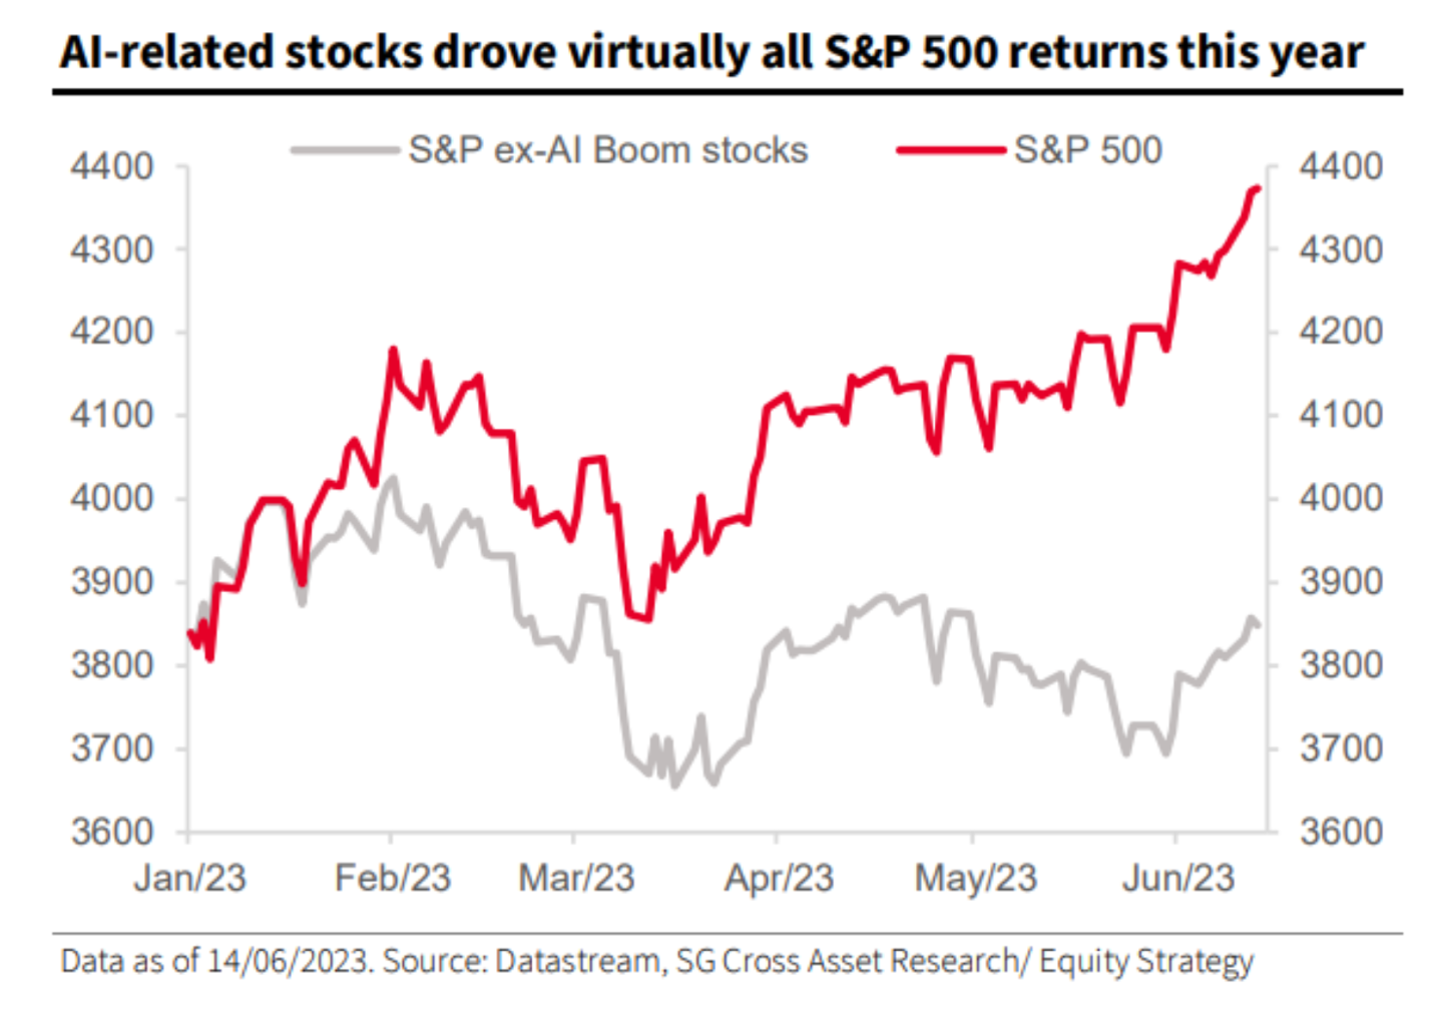
During Q3 of 2023 my portfolio returned 15.18% compared to 13.07% for the S&P 500 (with dividends reinvested).
The table below is a breakdown of my portfolio at the end of Q3 2023. What you see below where my entire net worth, excluding my home, is allocated. Lastly, my 401k is 100% invested in a Small Cap Value Fund.
| Company | % |
| BRK.B | 14.9% |
| CSV | 6.6% |
| MKL | 4.9% |
| MU | 4.7% |
| AIMFF | 2.8% |
| EPD | 2.6% |
| GVAL | 2.6% |
| AVES | 2.3% |
| DFEV | 2.3% |
| AVIV | 1.7% |
| C | 1.7% |
| DISV | 1.5% |
| BTI | 1.5% |
| DFIV | 1.5% |
| AVUV | 1.4% |
| DFSV | 1.3% |
| RSBT | 1.2% |
| SYLD | 1.2% |
| AVDV | 1.1% |
| IVAL | 1.0% |
| EQC | 1.0% |
| DFIC | 0.9% |
| PREKF | 0.9% |
| AVDE | 0.7% |
| FRFHF | 0.7% |
| FYLD | 0.6% |
| DEEP | 0.6% |
| FFBW | 0.3% |
| ET | 0.2% |
| NECB | 0.2% |
| WMPN | 0.1% |
| TCBC | 0.1% |
| CULL | 0.1% |
| PBBK | 0.1% |
| TCBS | 0.1% |
| CFSB | 0.1% |
| BSBK | 0.1% |
| FSEA | 0.1% |
| AVSC | 0.0% |
| EWUS | 0.0% |
| BWFG | 0.0% |
| CLBK | 0.0% |
| LAND | 0.0% |
| FPI | 0.0% |
| T Bills | 10.3% |
| Gold | 2.8% |
| Platinum | 0.6% |
| Farmland | 4.2% |
| I Bonds | 4.7% |
| Cash | 1.2% |
| 401k | 10.3% |
Below is a category breakdown:
| Bonds | 4.69% |
| Cash | 1.16% |
| Conglomerate | 14.91% |
| Financials | 3.01% |
| Funeral | 6.57% |
| Insurance | 5.57% |
| International | 16.30% |
| Managed Futures | 1.25% |
| Manager | 2.83% |
| Mid Cap Value | 1.19% |
| Oil/Gas | 3.69% |
| Precious Metals | 3.45% |
| Real Estate | 5.14% |
| Semiconductor | 4.66% |
| Small Cap Value | 13.72% |
| T Bills | 10.34% |
| Tobacco | 1.51% |
Commentary
I trimmed my Micron position, in my IRA, at a price point of about $71. In my taxable account I didn’t touch the Micron position. I added more to the Return Stacking ETF (RSBT). Other than that I haven’t made any meaningful changes to the account.
Below are charts and quotes I enjoyed during Q2 this year:
“Hope begins in the dark, the stubborn hope that if you just show up and try to do the right thing, the dawn will come. You wait and watch and work: you don’t give up.”— Anne Lamott
“When markets are at extreme highs or lows, the essential requirement for achieving a superior view of their future performance lies in understanding what’s responsible for the current conditions. Everyone can study economics, finance, and accounting and learn how the markets are supposed to work. But superior investment results come from exploiting the differences between how things are supposed to work and how they actually do work in the real world. To do that, the essential inputs aren’t economic data or financial statement analysis. The key lies in understanding prevailing investor psychology.” —Howard Marks
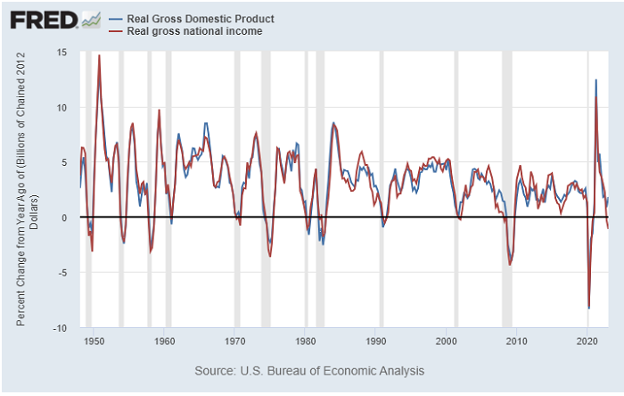
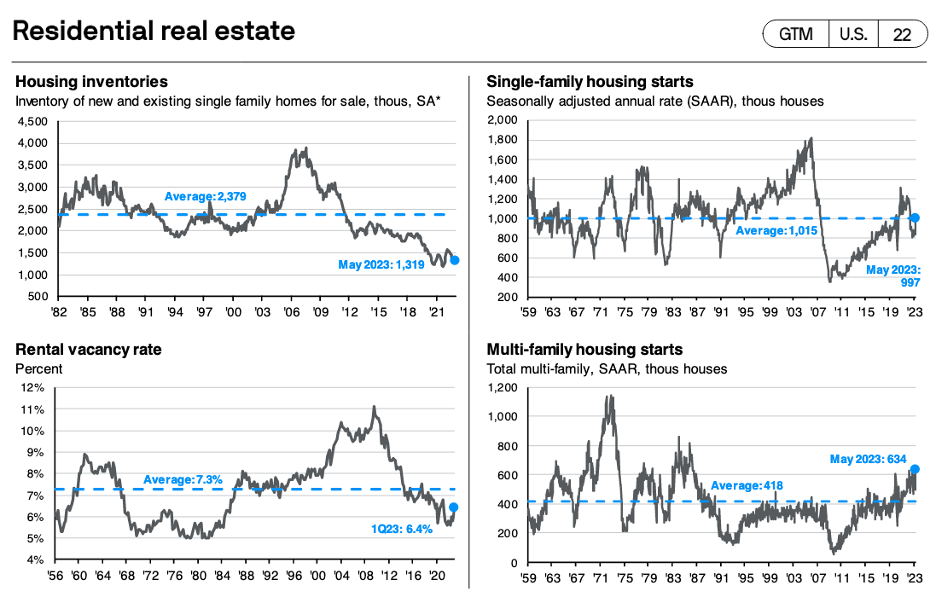
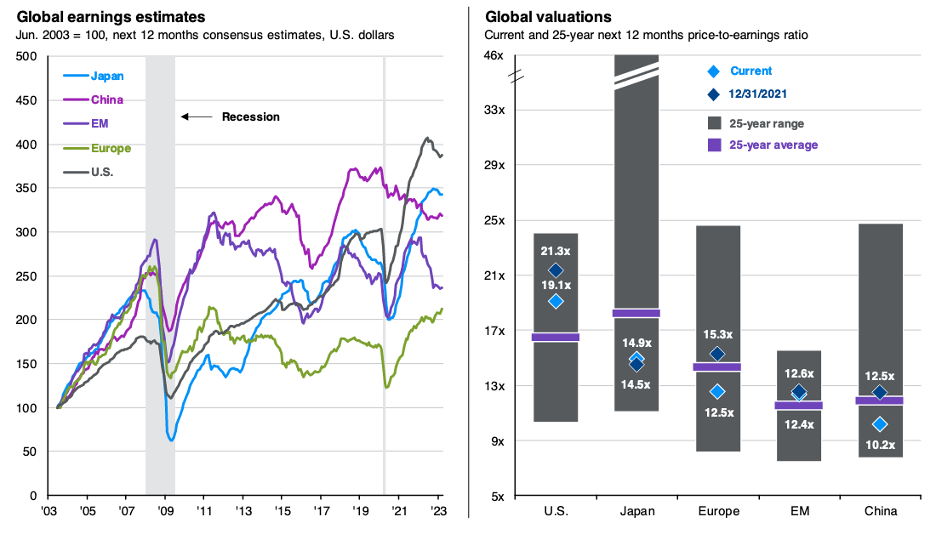
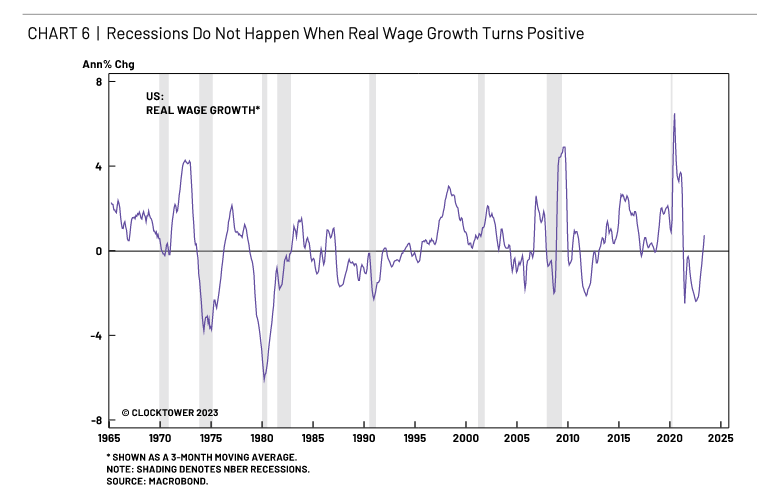
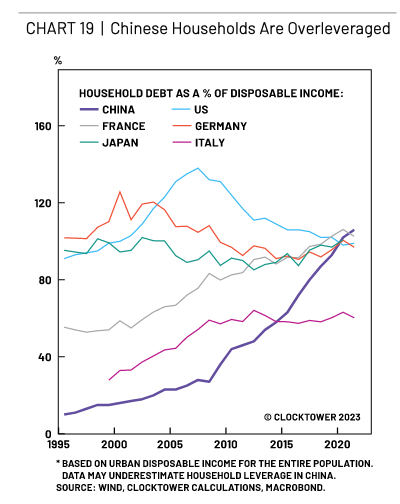
“Most forward indicators continue to suggest that recession is ahead.”
Source: https://www.lynalden.com/july-2023-newsletter/
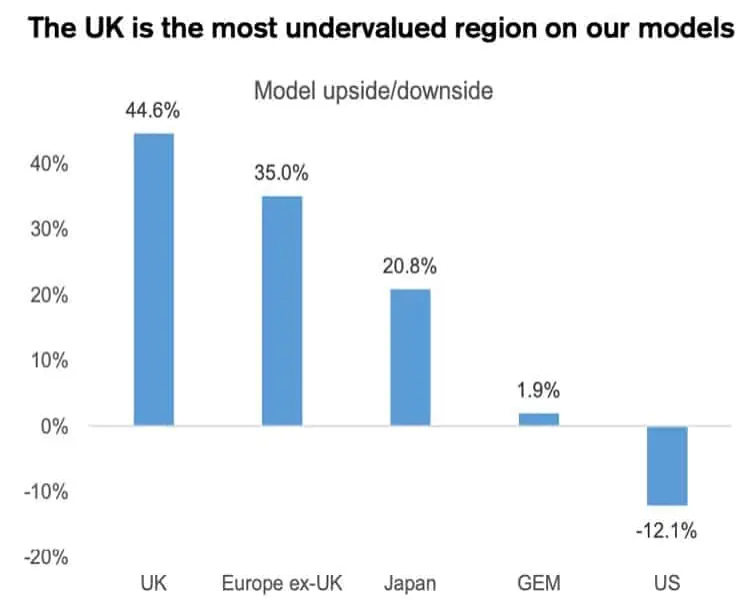
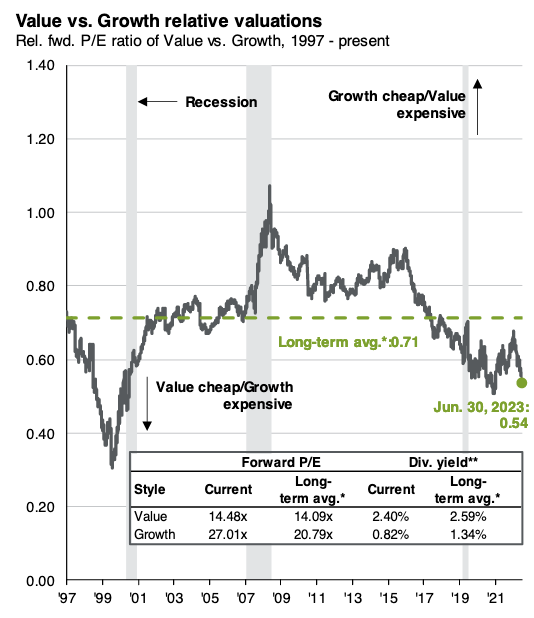
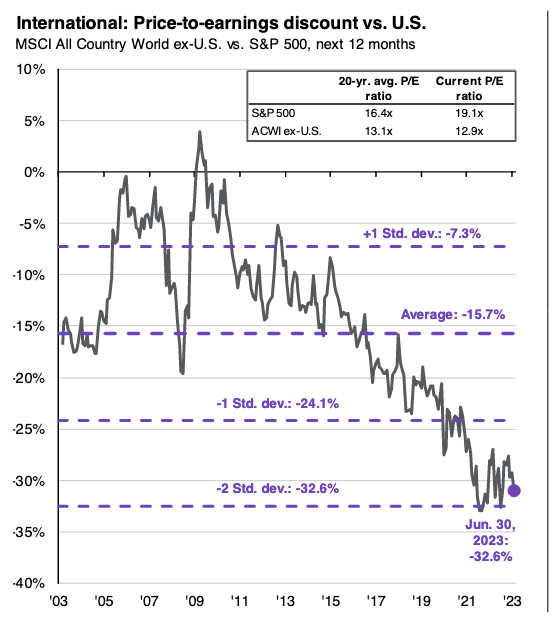
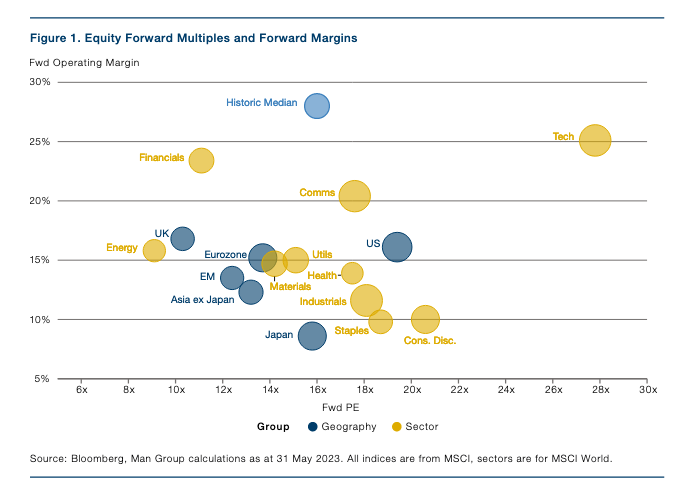
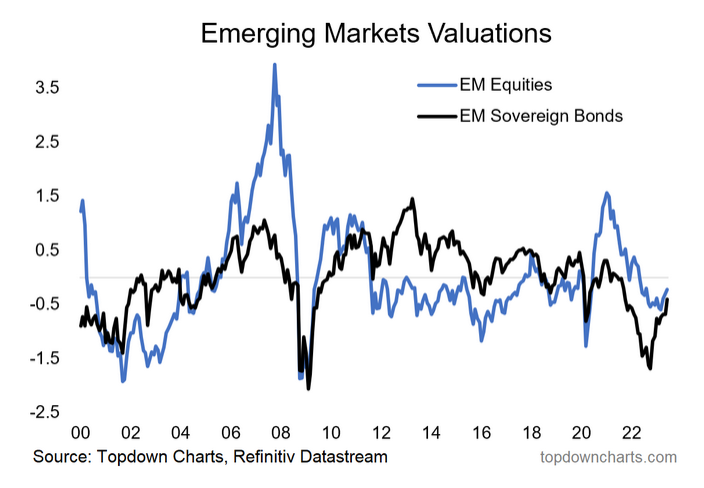
“In its high-level view of the British market, Credit Suisse just came to the interesting conclusion that “the UK is the most undervalued region on our models“.”
Source: https://www.wsj.com/articles/markets-ignore-the-looming-debt-peril-aac19b32?mod=markets_lead_pos1
Source: https://www.gmo.com/americas/research-library/slow-burn-minsky-moments_whitepaper/
Source: https://app.hubspot.com/documents/22324760/view/635945262?accessId=db9bba

Source: https://www.chartstorm.info/p/10-charts-to-watch-in-2023-half-time
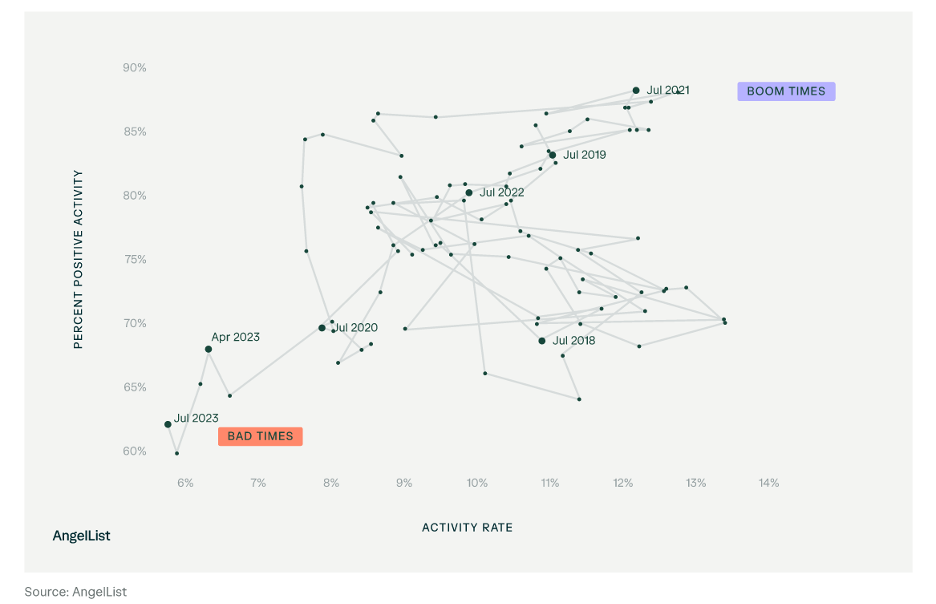
“AngelList’s quarterly report says that 2Q23 was “the worst quarter ever for startup dealmaking,” as activity rate dropped to a historical low and positive activity rate dropped to a near historical low. This comes just 2 years after the best quarter ever for startups on AngelList.”

“One common argument made by investors who refrain from global diversification is that, during systemic financial crises, everything does poorly, leading them to question the protection that international diversification offers during large market declines. While research may support this argument – that worst-case real returns for individual countries do tend to correspond with severe declines across all countries globally – the trend generally holds true only for the short term and the similarities in market behavior for countries around the globe tend to deteriorate over the long-term, as different countries naturally recover at different rates. But because no one can be sure of when and where these recoveries will happen, investors who are willing to spread the risk of slightly lower returns from globally diversified portfolios stand to yield the rewards of having an edge in the natural cycle of global markets in the aggregate.
Contrary to the view that global diversification may offer little protection from market declines, it is especially salient in cases of a worldwide recession – while the average individual country’s returns after such an event tend to stay depressed, global portfolios go on to eventually recover. In other words, while global diversification may not necessarily provide protection from the initial crash, it does create the potential for a significantly faster recovery. And this behavior tends to be more pronounced with longer time horizons – which are ultimately more relevant for investors with long-term wealth goals.”
Source: Larry Swedroe https://www.kitces.com/blog/international-diversification-equities-economic-theory-risk-management/
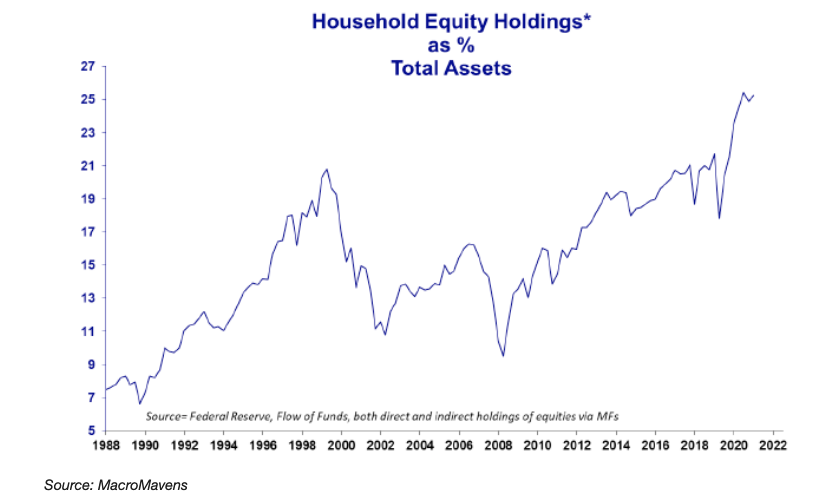
Source: https://macromavens.com/
Source: https://twitter.com/michael_venuto/status/1692644541088542891?s=20
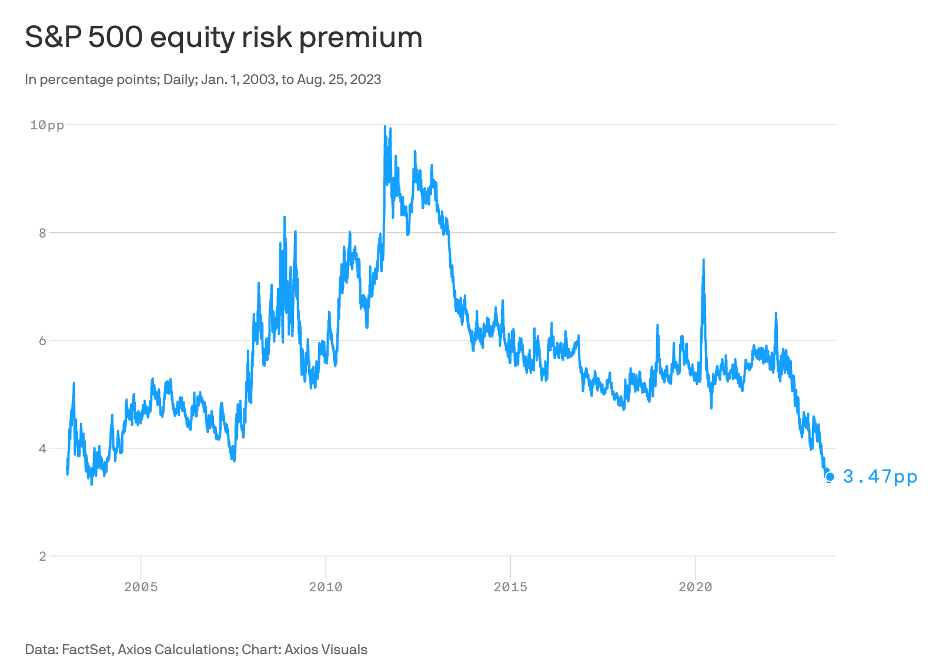
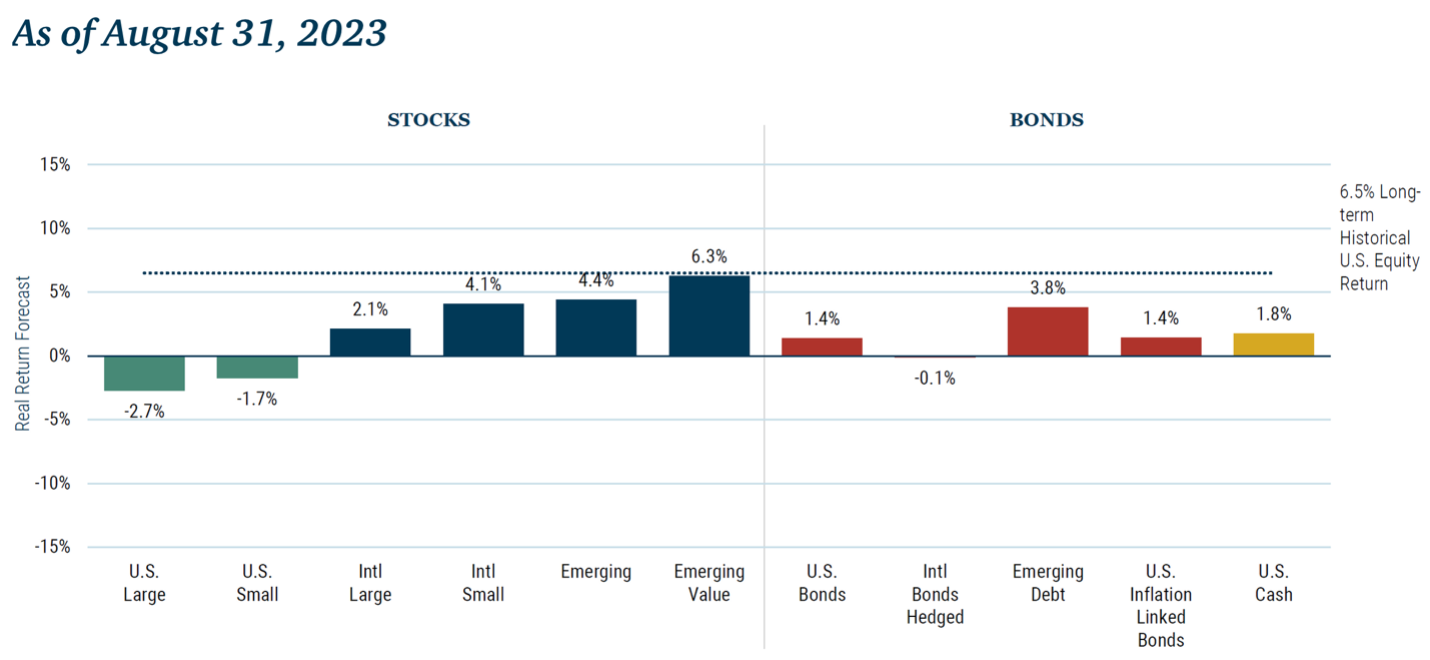
Be smart: Despite the mathematical nature of this analysis, this is art, not science. There are plenty of ways to calculate and compare these numbers.
- I’ve calculated the earnings yield on the S&P 500, by looking at expected earnings per share of the index over the next 12 months. That gives me an earnings yield of about 5.4%.
- To get the risk premium, you then subtract the 1.9% TIPS yield from that number, giving you a 3.5 percentage point difference.
Source: https://www.axios.com/2023/08/29/interest-rates-stocks-bonds-returns
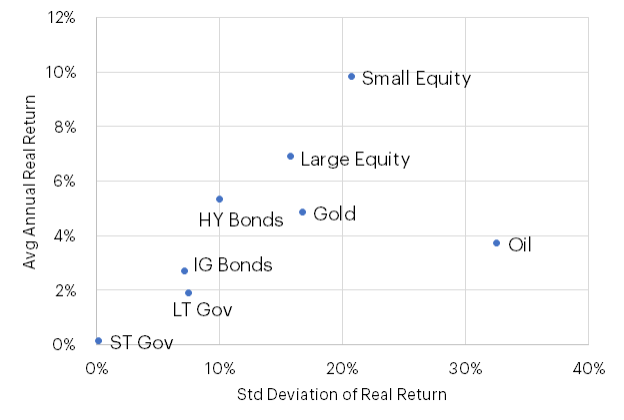
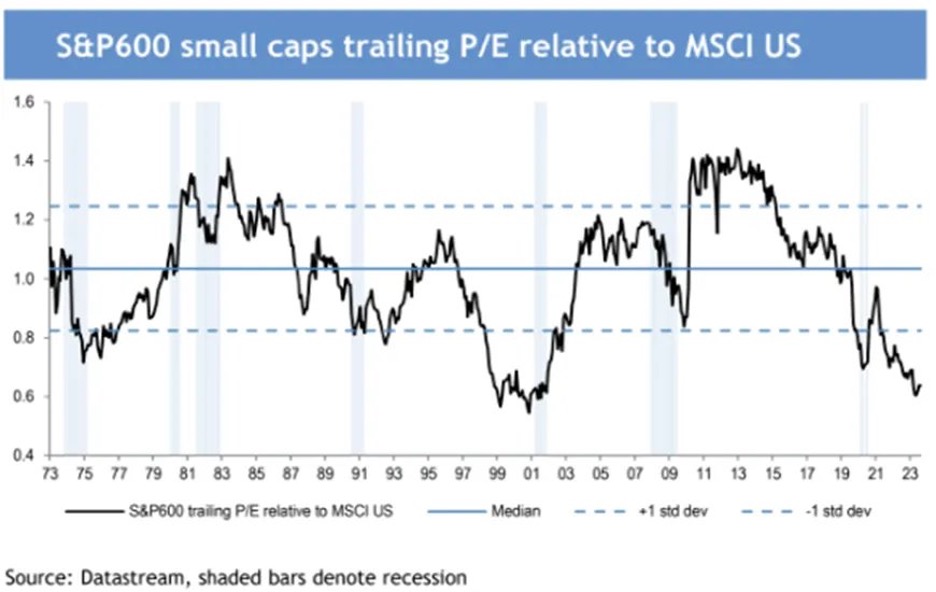
“As shown above, there is a general gradient of risk and return along which most asset classes can be plotted. Toward the bottom left (lowest risk and lowest return), we have a range of fixed-income securities, ranging in degree of risk/return from short-dated government bonds to high-yield bonds. Then we have equities, which are similarly graduated from large-cap US stocks (safest) to small-cap US stocks (riskiest). Oil seems to be the exception to the CAPM line, exhibiting very high volatility and relatively low returns.”
Source: https://mailchi.mp/verdadcap/asset-class-capm?e=e1c5773556


