Q2: Thou Shalt Not Take Oneself Seriously

Disclaimer

Nothing discussed/written should be considered as investment advice. Please do your own research or speak to a financial advisor before putting a dime of your money into these crazy markets. In other words, if you buy something I bought, you deserve to lose your money.

The only reason why I am making my portfolio public because it provides accountability to me. Some or all the analysis I provide could be from the top of my head and should not be considered accurate.

My investing goal is simple; to try to manage risk while being fully invested without market timing. Howard Marks said it best, “even though we can’t predict, we can prepare.”

All my references to the Market are only for the US Market.

Performance

During Q2 of 2023 my portfolio returned 15.18% compared to 16.89% for the S&P 500 (with dividends reinvested).

The table below is a breakdown of my portfolio at the end of Q2 2023. What you see below where my entire net worth, excluding my home, is allocated. Lastly, my 401k is 100% invested in a Small Cap Value Fund.

BRK.B14.6%
MU8.1%
CSV7.6%
MKL4.6%
GVAL3.3%
AIMFF3.1%
EPD2.6%
DFEV2.4%
AVES2.3%
C1.9%
AVIV1.7%
BTI1.6%
AVDV1.5%
DISV1.5%
DFIV1.5%
AVUV1.4%
DFSV1.3%
DFIC0.9%
PREKF0.8%
DEEP0.6%
RSBT0.5%
IVAL0.5%
FFBW0.3%
AVDE0.3%
NECB0.2%
PBBK0.1%
TCBC0.1%
CULL0.1%
WMPN0.1%
TCBS0.1%
CFSB0.1%
BSBK0.1%
FSEA0.1%
AVSC0.0%
EWUS0.0%
BWFG0.0%
CLBK0.0%
LAND0.0%
FPI0.0%
T Bills9.6%
Gold2.9%
Platinum0.6%
Farmland3.8%
I Bonds7.0%
Cash0.5%
401k9.6%

Below is a category breakdown:

Bonds6.97%
Cash0.52%
Conglomerate14.56%
Financials3.24%
Funeral7.56%
Insurance4.58%
International15.96%
Managed Futures0.48%
Manager3.10%
Oil/Gas3.37%
Precious Metals3.57%
Real Estate3.84%
Semiconductor8.06%
Small Cap Value12.96%
T Bills9.63%
Tobacco1.60%

Commentary

I sold all my shares of MMP, INTC, HII and LMT. Currently, there is a proposal by Oneok, Inc. to buy Magellan Midstream Partners. I personally do not like the deal. I think Magellan’s management is selling itself for too cheap of a price. Magellan is selling itself for about $65 a share and I think the value of the stock is somewhere in the $80s. If the deal doesn’t go through I’ll re-buy the shares. The shares were sold in my Roth IRA which means I’ll never have to pay taxes on my gains.

I finally moved on from my Intel bet. I’ve met some employees who work them and from what I can gather is the company is a bureaucratic mess and I no longer wanted to invested in a company with a bad culture.

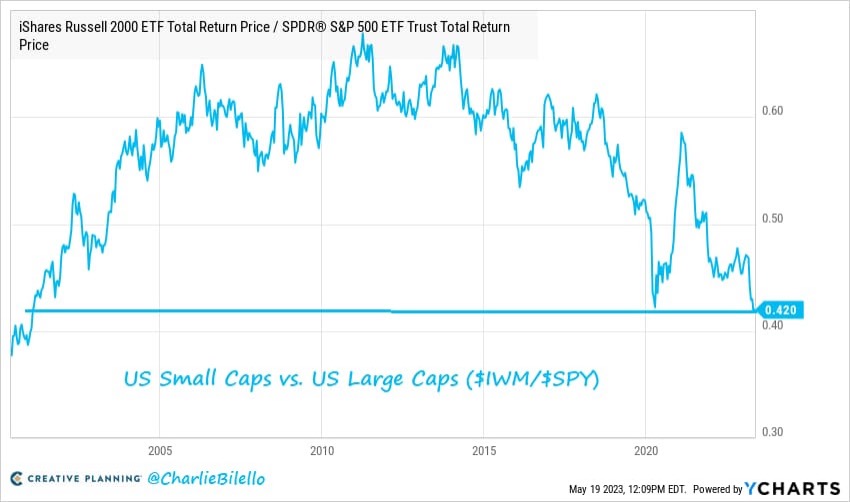
Lockheed Martin and Huntington Ingalls Industries were tiny positions and I sold both at a reasonable profit. These were sold because I believe there is bigger opportunity for Emerging Markets and US Small Cap Value. The vast majority of the proceeds from the selling was given to Emerging Market and International ETFs. I did add a tiny bit to British American Tobacco, Citigroup and Berkshire Hathaway.

I also created new positions in DEEP and RSBT. The former is the Roundhill Acquirers Deep Value. On a recent Meb Faber podcast, Ben Inker & Tom Hancock from GMO said the lowest 20% of Value (i.e. deep value) was incredibly cheap. RSBT is a Bonds & Managed Futures that utilizes return stacking. The primary reason why I wanted exposure to this ETF is because I wanted access to managed futures, which historically, has been diversifier from stocks AND has done well in inflationary periods. Basically the ETF provides bonds exposure stacked with managed futures.

In regards to Carriage Services, management is considering an offer from Park Lawn. That’s all that is publicly known right now. I have a sneaky suspicion that, like MMP, the price will be too low.

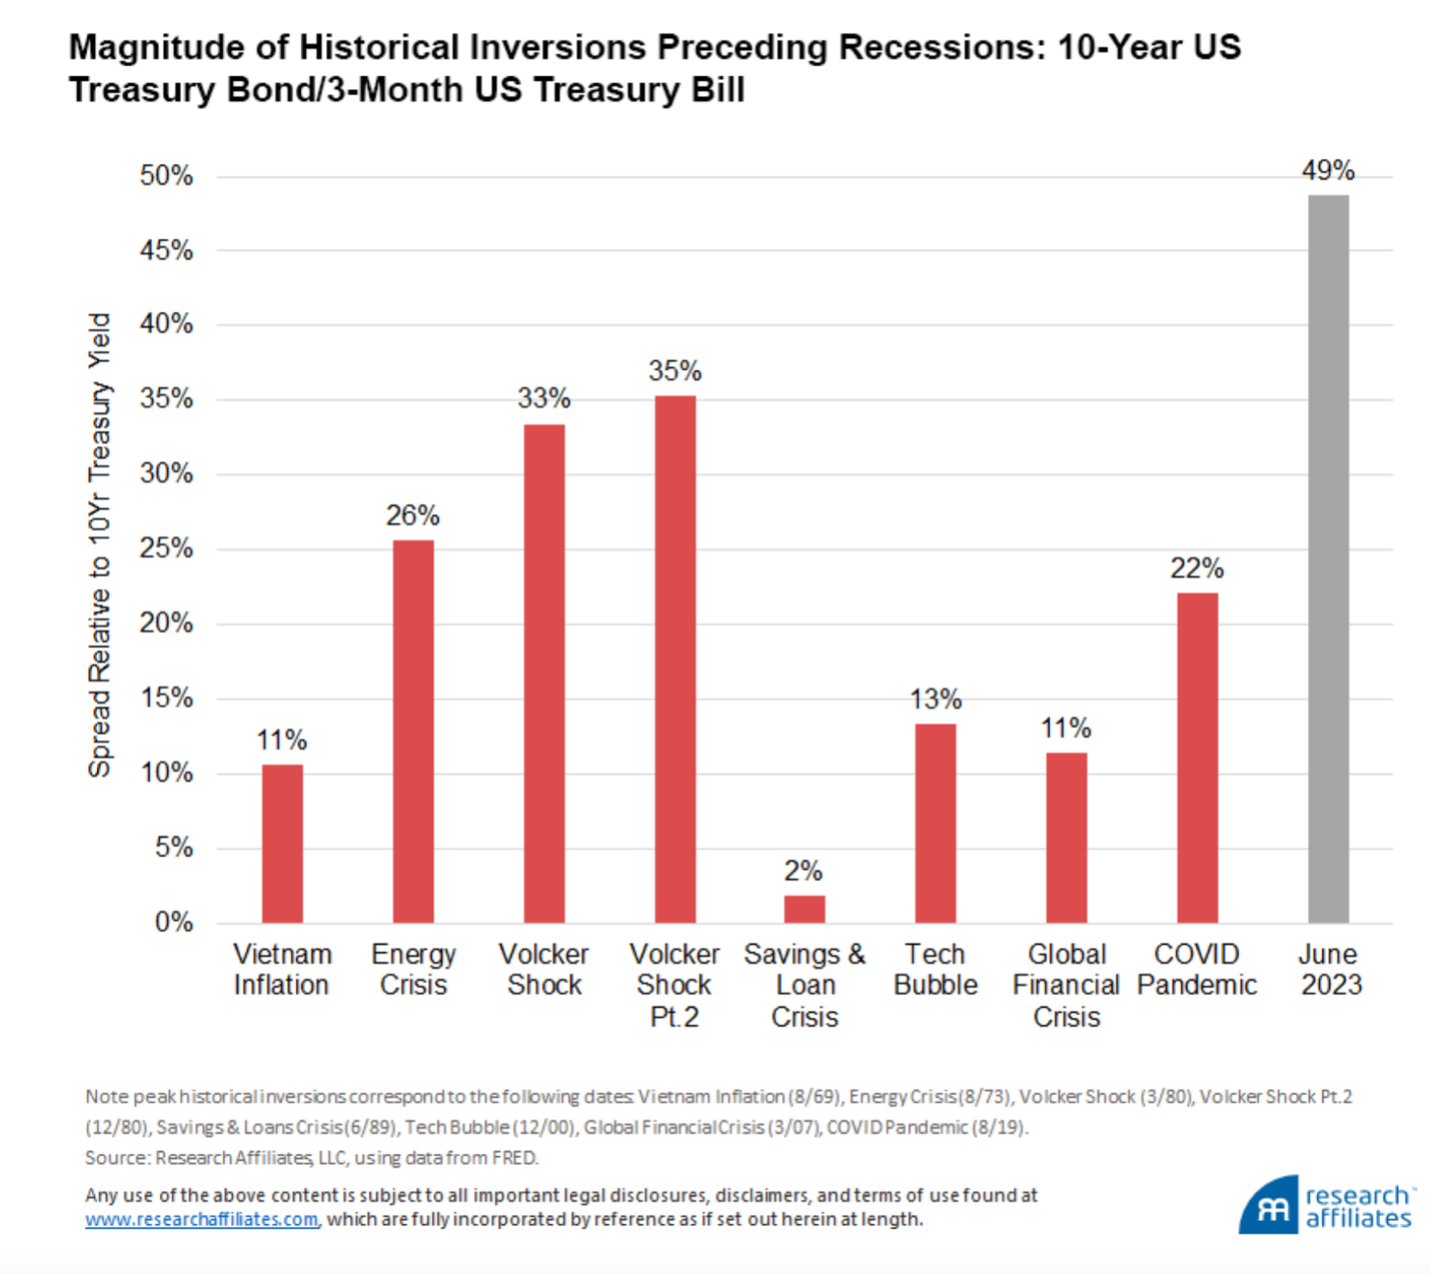
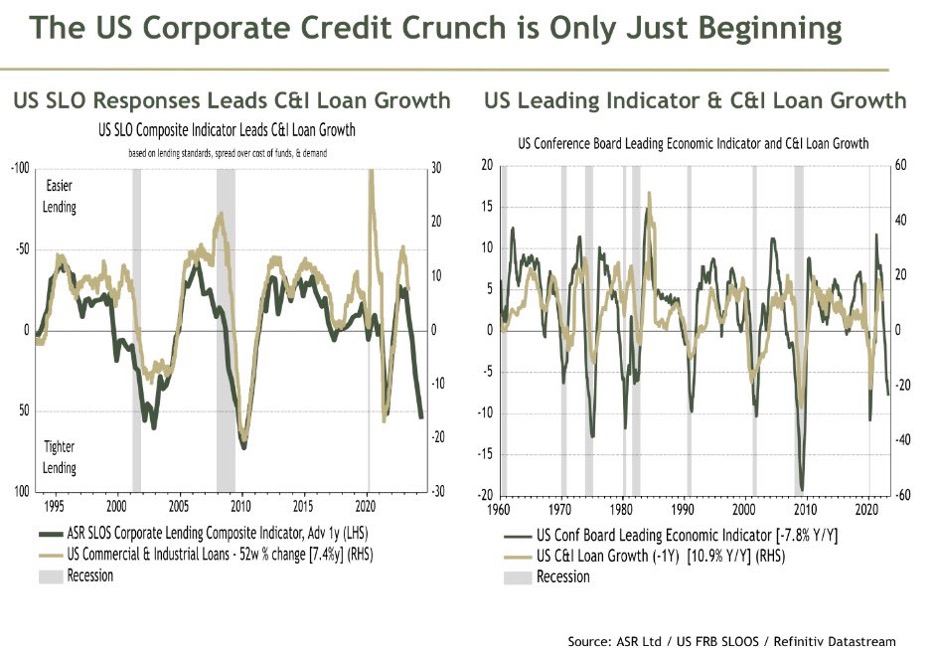
At the beginning of the year I was a fully invested bear. I was bearish but I didn’t reduce my exposure to stocks this year. I still think there’s a going to be a crash because I think wage inflation is real and the Federal Reserve needs to cool down the economy. Also, a lot of corporate debt needs to be refinanced in 2027 which means that debt will be refinanced in 2025 and 2026 which means the Market will start pricing that in 2024.

Below are charts and quotes I enjoyed during Q2 this year:

“My favorite 11th commandment is, ‘Thou shalt not take oneself seriously.’ You need to constantly challenge your own thoughts.” —Sam Zell

“The one thing I will tell you is the worst investment you can have is cash. Everybody is talking about cash being king and all that sort of thing. Cash is going to become worth less over time. But good businesses are going to become worth more over time. And you don’t want to pay too much for them so you have to have some discipline about what you pay. But the thing to do is find a good business and stick with it. We always keep enough cash around so I feel very comfortable and don’t worry about sleeping at night. But it’s not because I like cash as an investment. Cash is a bad investment over time. But you always want to have enough so that nobody else can determine your future essentially.” —Warren Buffett

“I’ve been thinking lately about the fact that being an investor requires a person to be somewhat of an optimist. Investors have to believe things will work out and that their skill will enable them to wisely position capital for the future. Equity investors have to be particularly optimistic, as they have to believe someone will come along who’ll buy their shares for more than they paid. My point here is that optimists surrender their optimism only grudgingly, and phenomena such as cognitive dissonance and self-delusion permit opinions to be held long after information to the contrary has arrived. This is among the reasons why they say of the stock market: “Things can take longer to happen than you thought they would, but then they happen faster than you thought they could.” Today’s sideways or “range-bound” market tells me investors possess a good amount of optimism despite the worries that have arisen. In the coming months, we’ll find out if the optimism was warranted.” Howard Marks

“It has taken me years to unlearn everything I was taught, and I probably haven’t succeeded yet. I cite this only because most of what has been written about the market tells you the way it ought to be, and the successful investors I know do not hold to the way it ought to be, they simply go with what is.” —George Goodman

Source: https://mcusercontent.com/6750faf5c6091bc898da154ff/files/bc56a117-255c-c56a-ee9e-928c8c11a239/AQR_Re_Emerging_Equities_March.pdf

  • 55.2% of U.S. stocks and 57.4% of non-U.S. stocks underperform one-month U.S. Treasury bills in terms of compound returns over the full sample
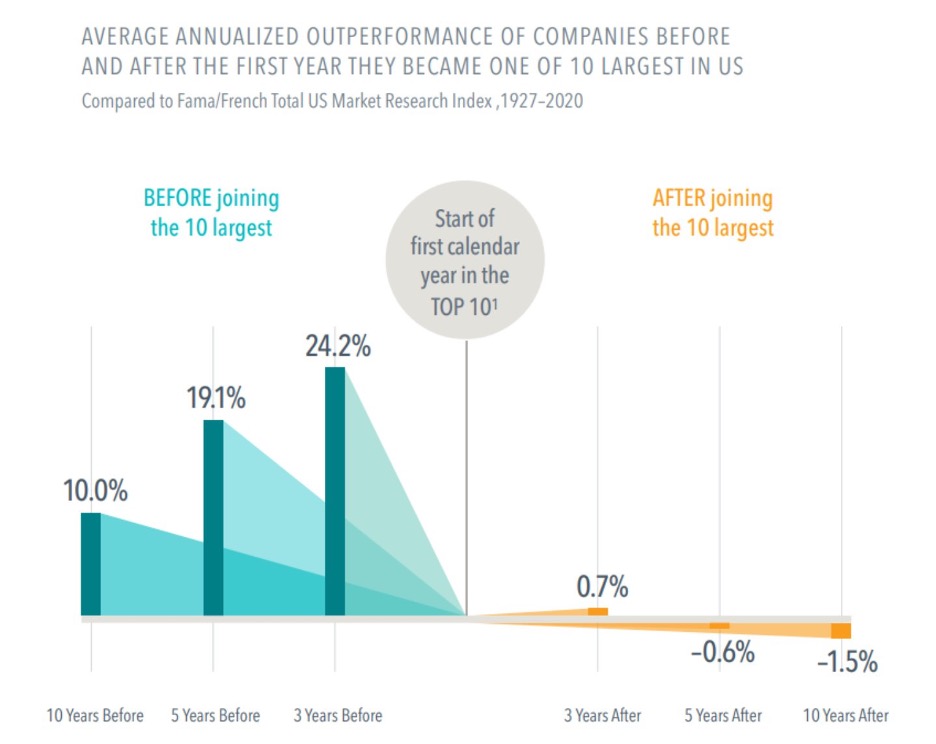
  • The top-performing 2.4% of firms account for all of the $US 75.7 trillion in net global stock market wealth creation from 1990 to December 2020
  • Outside the US, 1.41% of firms account for the $US 30.7 trillion in net wealth creation

Source: https://mcusercontent.com/6750faf5c6091bc898da154ff/files/877adfb5-905a-a09f-a834-2a197047d40e/SSRN_id3710251.pdf

Source: https://mcusercontent.com/6750faf5c6091bc898da154ff/files/ac8c643b-2c3d-f4ec-80b7-e8db3ecdbdda/an_update_from_our_cios_the_tightening_cycle_is_beginning_to_bite.pdf

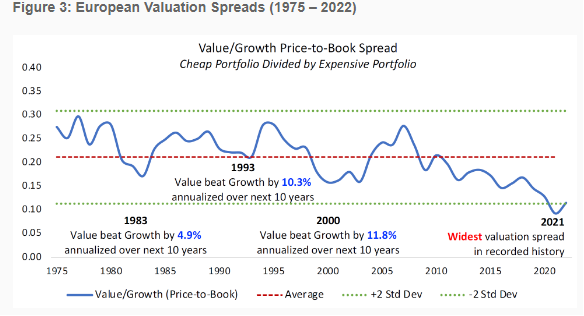
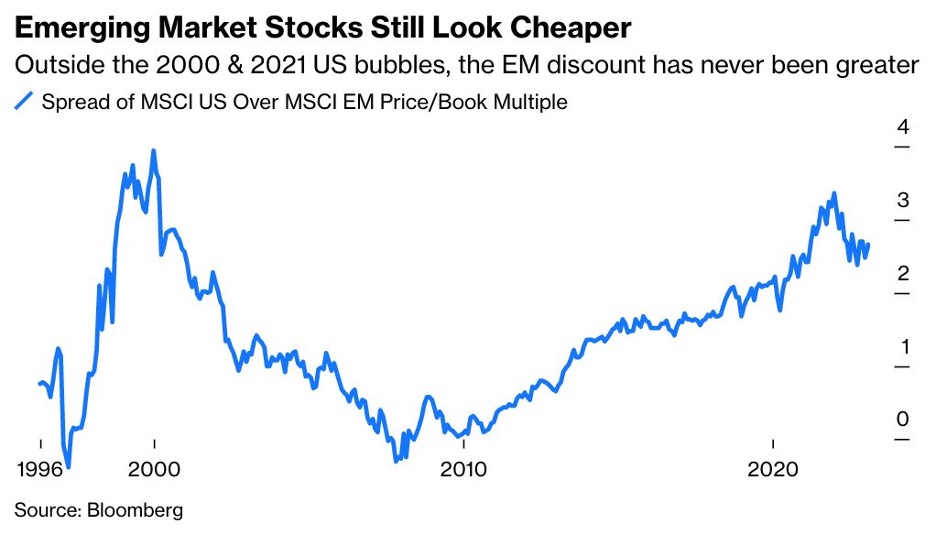
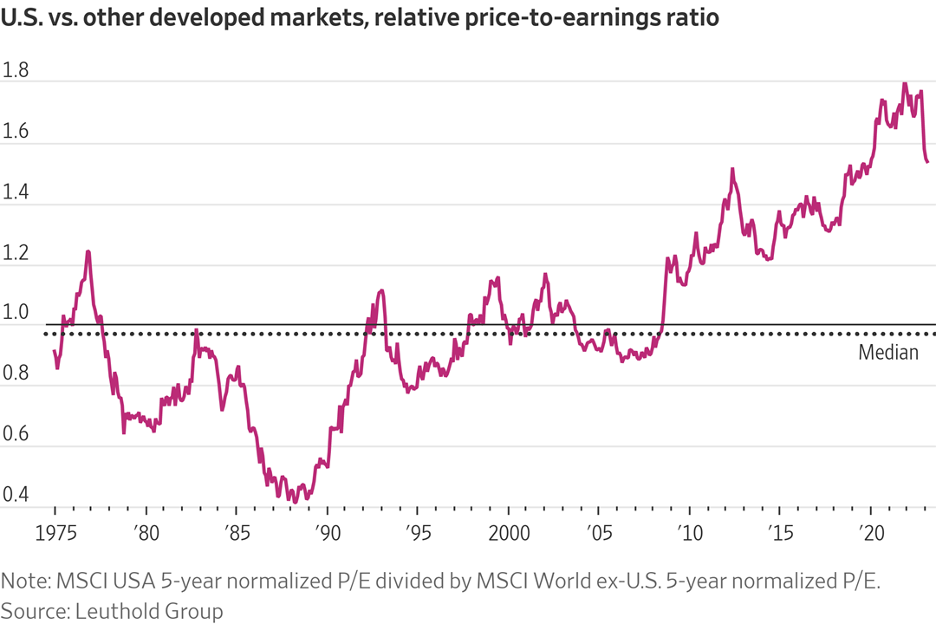
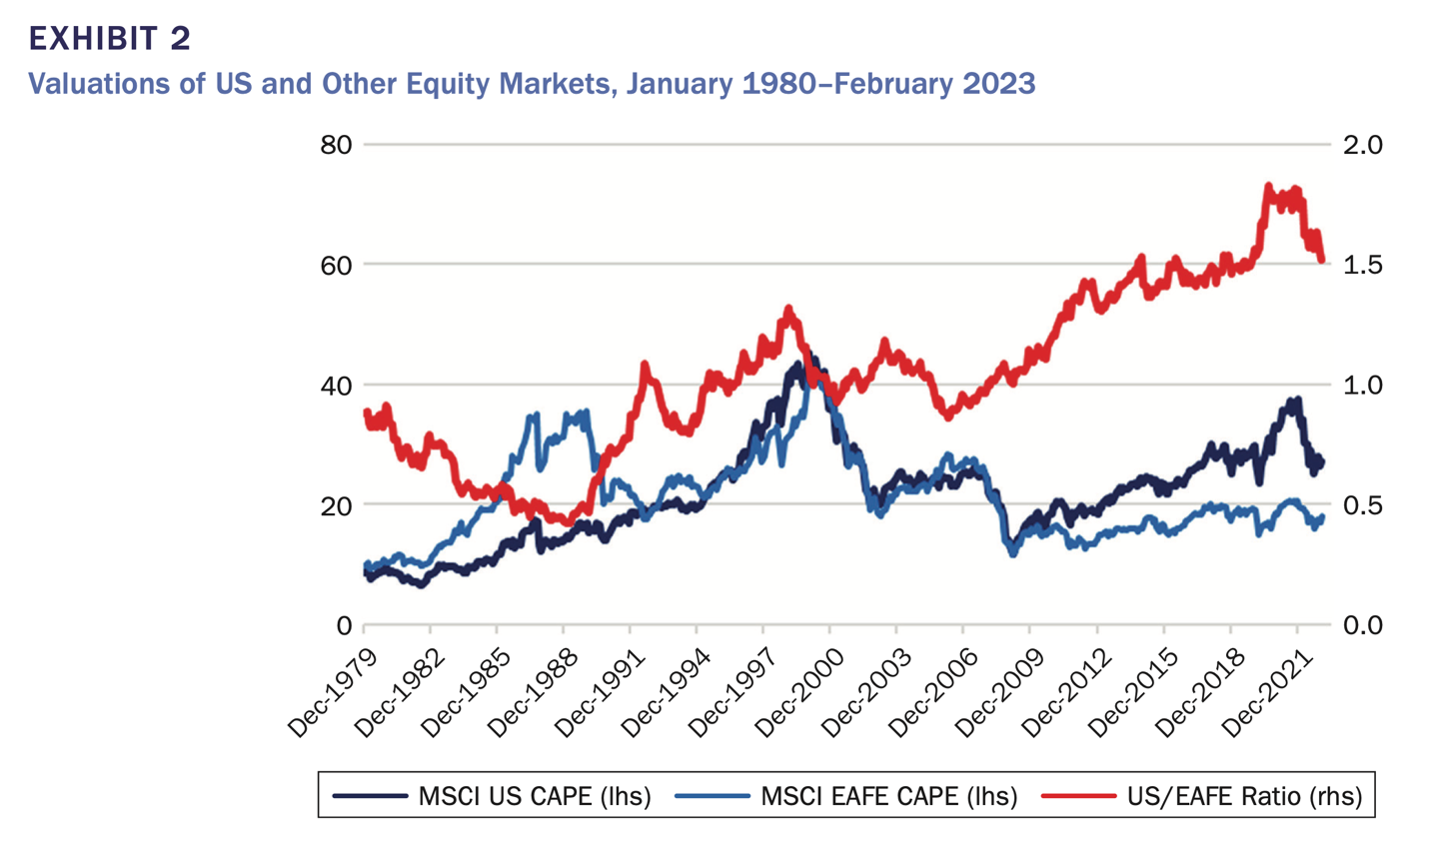
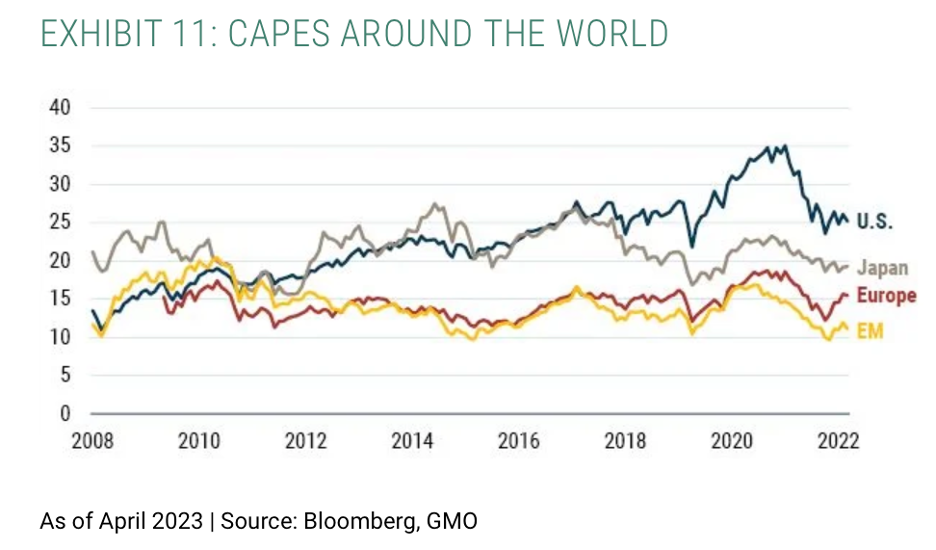
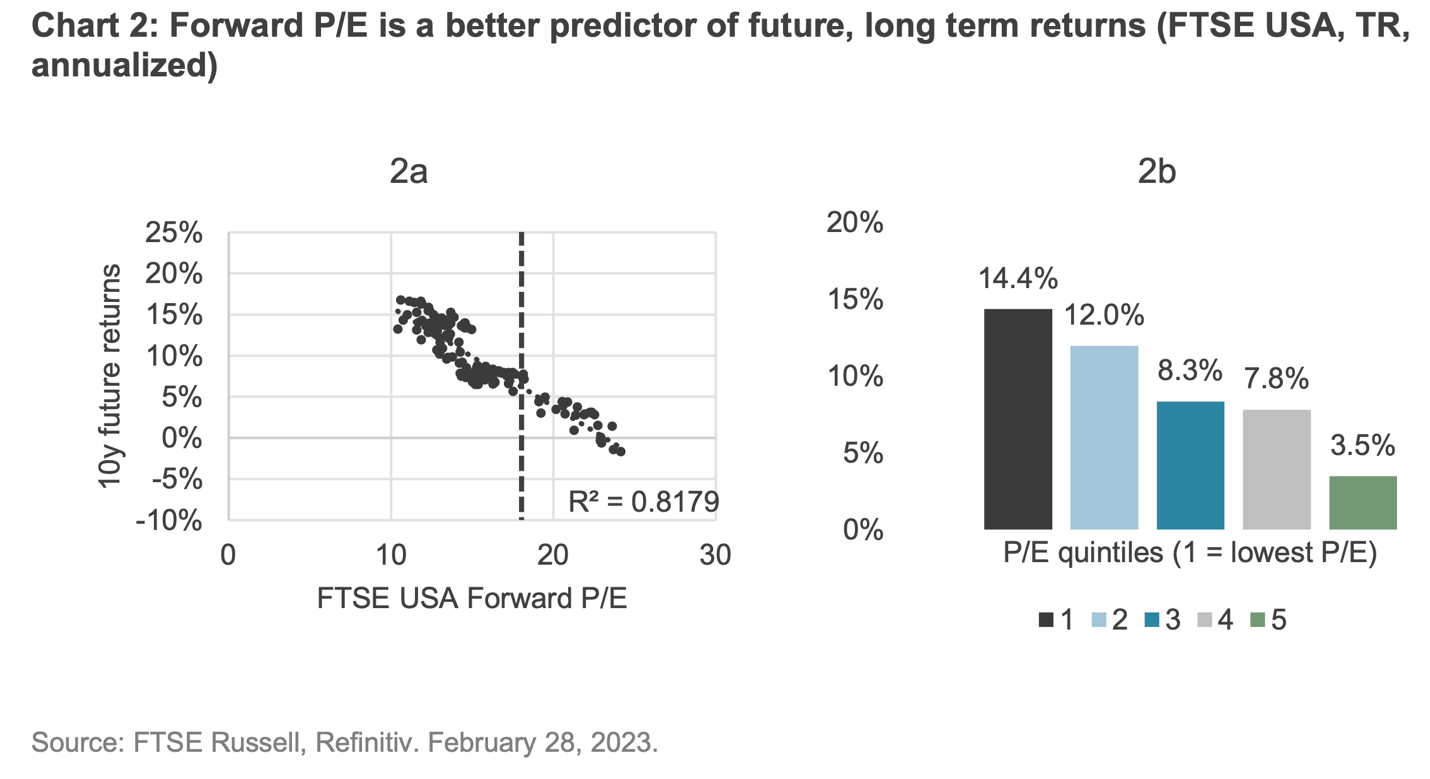
“Exhibit 2 shows that the relative valuations (using the Shiller CAPE ratio) between US and EAFE equities kept increasing through the 2010s and rose to a historic high of 1.8 in 2020–2021. The relative CAPE ratio fell in 2022 but remains extremely wide. The positive story is that the US is rich for a reason—it is indeed hard to love European or Japanese equities except for valuation reasons.18 But valuations count. Historically, value strategies outperform, but not because they pick better companies (or here, better countries), rather because the discount/premium in the worse/better companies (or countries) was too extreme.”

Source: https://mcusercontent.com/6750faf5c6091bc898da154ff/files/513ed099-0237-28c6-bba8-aa2789e23107/valuation_matters___us_high_yield_and_us_equities.pdf

Source: https://www.gmo.com/americas/research-library/the-curious-incident-of-the-elevated-profit-margins-part-1_whitepaper/

Source: https://www.gmo.com/americas/research-library/gmo-7-year-asset-class-forecast-may-2023_gmo7yearassetclassforecast/

Source: https://mcusercontent.com/6750faf5c6091bc898da154ff/files/513ed099-0237-28c6-bba8-aa2789e23107/valuation_matters___us_high_yield_and_us_equities.pdf

Source: https://twitter.com/MebFaber/status/1663990721593090058/photo/1

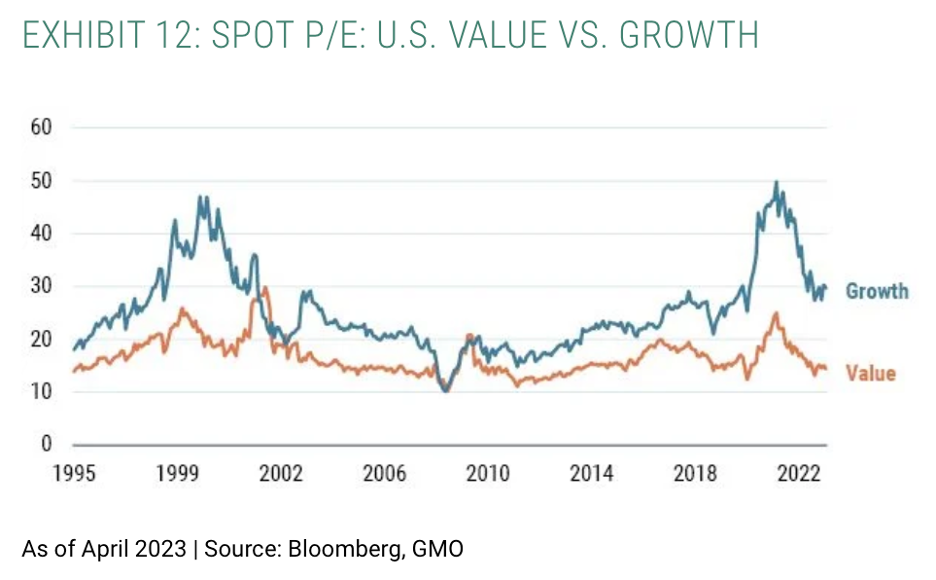
“A core concern for investors contemplating taking advantage of the incredible cheapness of deep value stocks today is the potential for a near-term recession. A common perception is that value stocks are more cyclical and therefore more vulnerable to economic downturn.

We find that this conventional wisdom is false: empirical evidence shows that value stocks actually tend to outperform in recessions. Value stocks have the charm of low expectations. No one is expecting all that much from them, so they have less to lose in an economic environment in which companies of all stripes wind up having a tough time.

Based on current valuations, deep value is priced to significantly outperform the rest of the market. Our analysis suggests that the prospect for deteriorating economic conditions in no way impairs this thesis.”

Source: https://www.gmo.com/americas/research-library/value-does-just-fine-in-recessions_whitepaper/

Source: https://www.bloomberg.com/opinion/articles/2023-06-01/ai-high-tech-investors-write-stock-history-again-but-losses-also-lurk

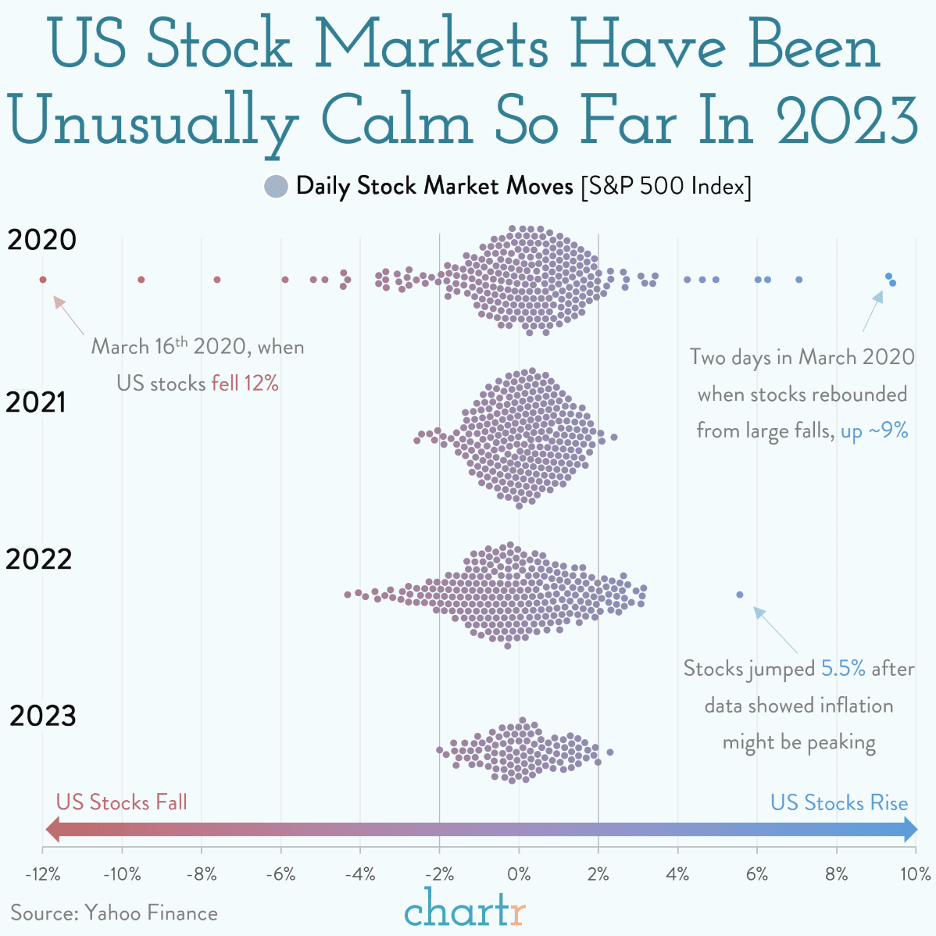
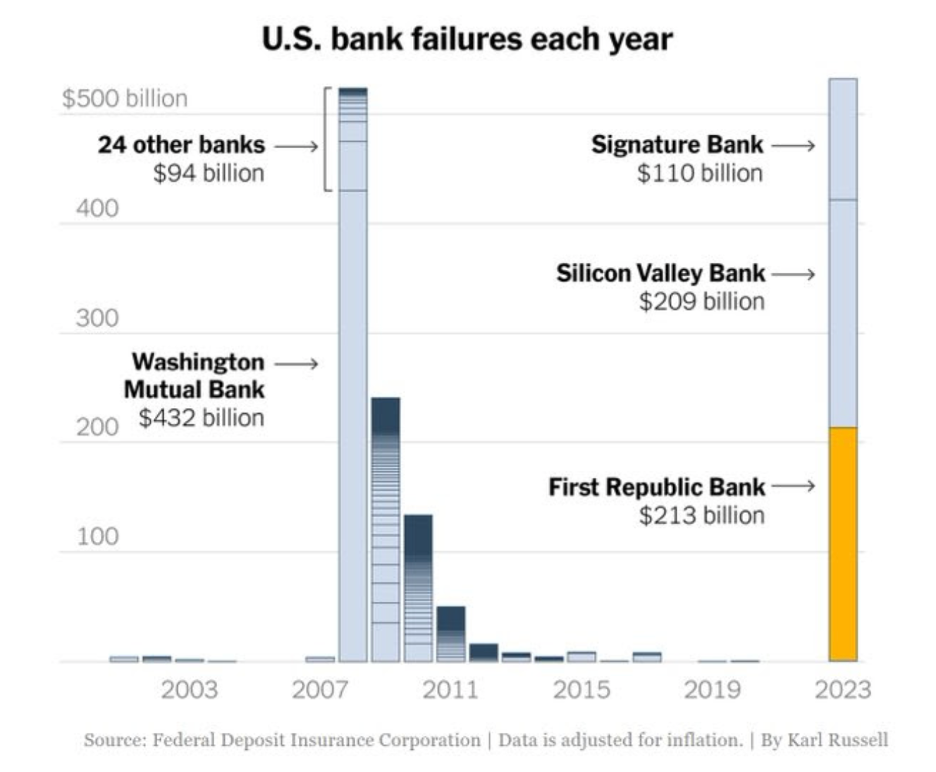
Source: https://www.chartr.co/newsletters/2023-05-29

Source: https://corporate.vanguard.com/content/corporatesite/us/en/corp/articles/making-case-international-equity-allocations.html

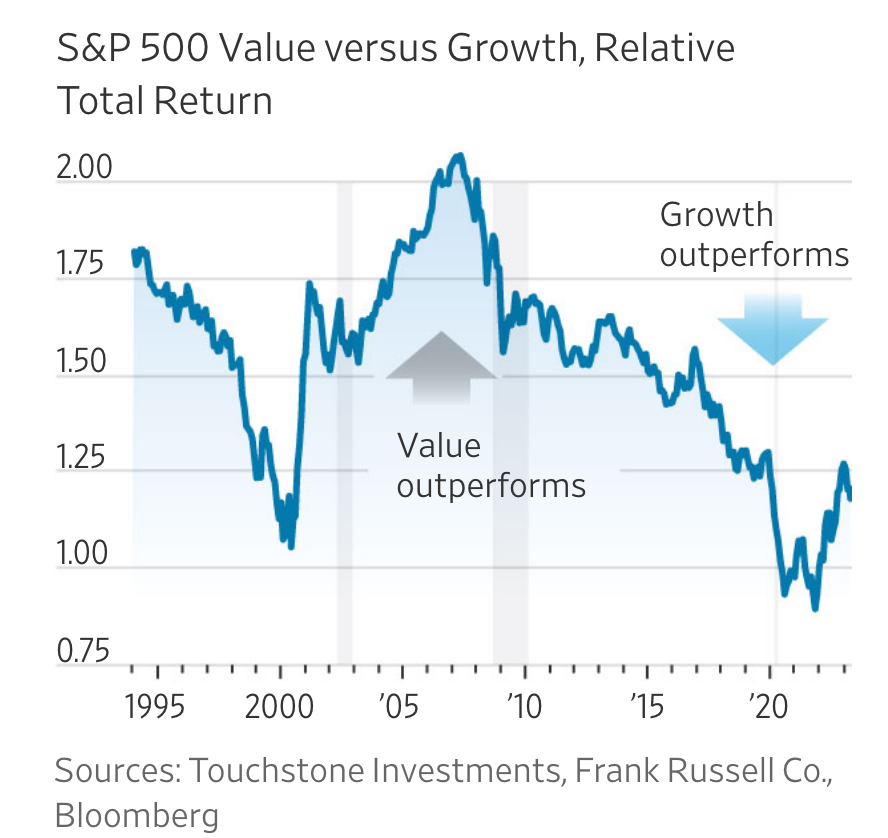
Source: https://www.wsj.com/articles/investing-value-stocks-2be29ad9

“A common perception is that value stocks are more cyclical and therefore more vulnerable to economic downturn,” he said in a white paper. “We find that this conventional wisdom is false.”

Source: https://www.barrons.com/articles/value-stocks-cheap-recession-research-e59349e8

“Our analysis shows price-to-book can provide a similar expected return with lower turnover and more control over the exposures to multiple premiums in a systematic investment solution.”

Source: https://mcusercontent.com/6750faf5c6091bc898da154ff/files/4e0d4d9a-6b67-3c12-e5a8-0c1f998b76d3/assessing_alternative_value_metrics_12fs.pdf

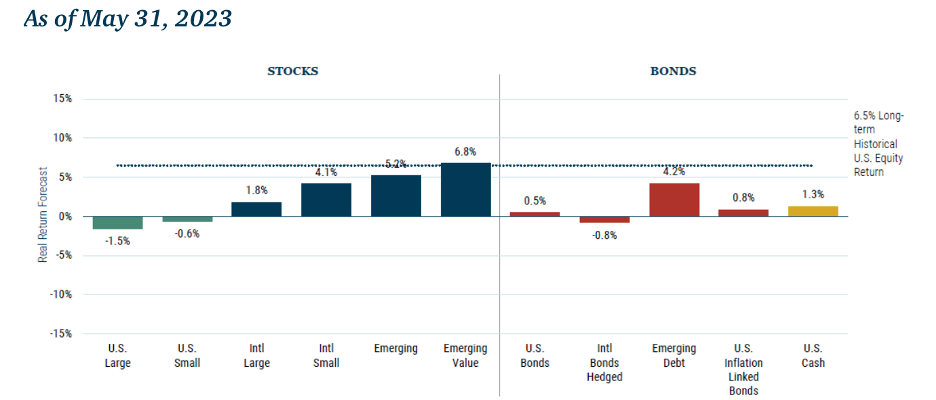
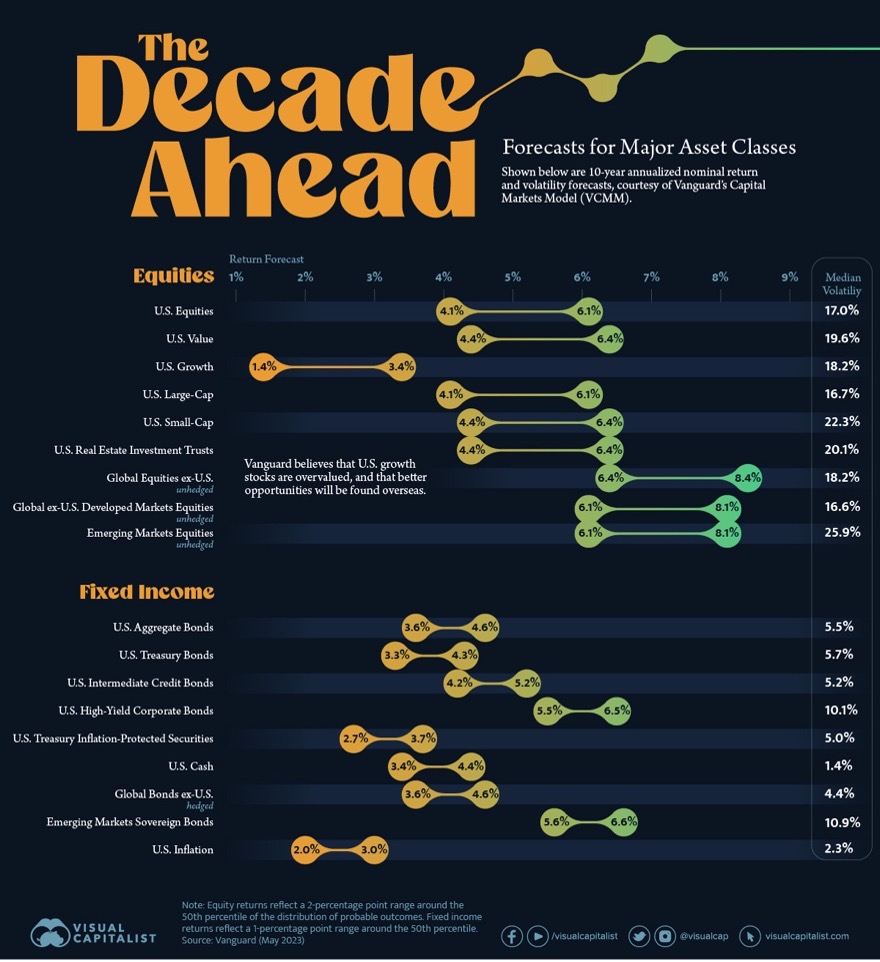
Source: https://www.visualcapitalist.com/10-year-annualized-forecasts-for-major-asset-classes/

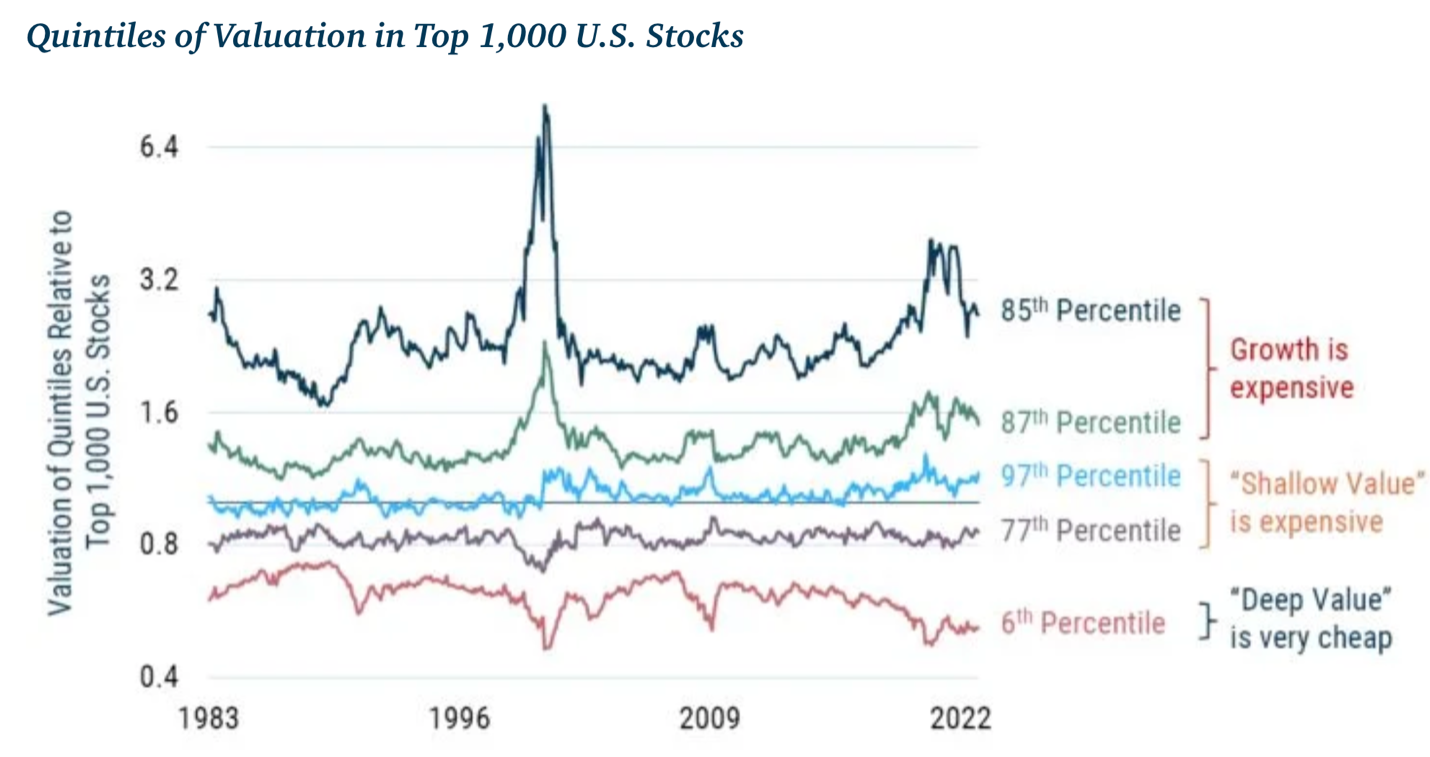
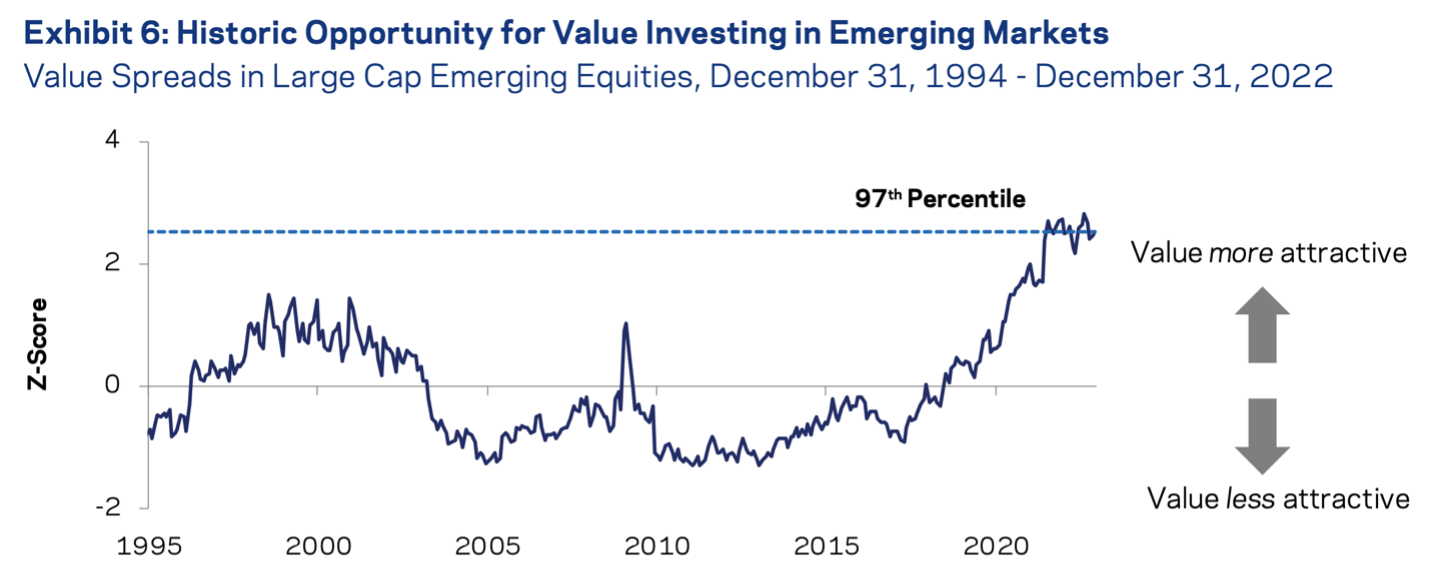
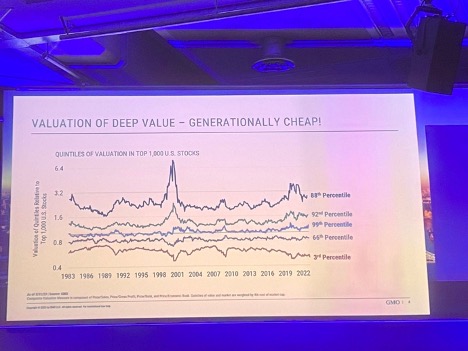
“He mined GMO’s database looking at the difference between deep value (the cheapest quintile) and shallow (or ordinary) value (the second cheapest quintile). He explained that the spread of valuation across markets is critical to achieving outperformance. He also said that he believes today “deep value is generationally cheap”

Inker showed that the most expensive stocks were in their 88th percentile of value and the cheapest were in their 3rd. This means they are almost as dear and cheap as they have ever been, with deep value stocks cheaper than they were in the dot com boom. Excluding financials only takes deep value up to its 5th percentile. So this is not simply about cheap banks!

Interestingly, ordinary or shallow value (the second cheapest group) was in its 66th percentile, making it more expensive than normal. So if you’re looking for “generational” value, you need to go really cheap.

Inker emphasised that this was not a US phenomenon. Even if you exclude financials, and in every region globally, deep value is at a 1 in 20 year low.

Surprisingly, the most expensive stocks are even dearer outside the US. The cheapest stocks are almost as cheap and are still at extremely cheap levels. Regular or shallow value is cheaper globally than in the US. Note that the top 3 quintiles are all much more expensive than is normal, both internationally and in the US.”

Text Source: Behind the Balance Sheet Substack

Image Source: Ben Inker, GMO’s strategist, titled “Value Investing isn’t What you Think it is”.

The successful contrarian has to:

  • Observe the playing field and understand what expectations are priced in;
  • Develop a variant perception when price diverges substantially from value;
  • Have the courage to diverge from herd (miss out on near-term opportunities, possibly shut down lines of business);
  • Create conditions that allow her to diverge from the herd (sufficient cash flow, liquidity reserves);
  • Act during a limited window of opportunity; be able to source deals, raise capital under adverse conditions, and turn around underperforming assets.

Source: https://neckar.substack.com/p/the-courage-to-stand-out-sam-zells

Source: https://mcusercontent.com/6750faf5c6091bc898da154ff/files/a7ff9673-4eaa-4a9c-6aa0-a5e033a7394f/987_odds_of_a_hard_landing.pdf

Posted in Investing | Leave a comment

Q1 2023: Waiting

Disclaimer

Nothing discussed/written should be considered as investment advice. Please do your own research or speak to a financial advisor before putting a dime of your money into these crazy markets. In other words, if you buy something I bought, you deserve to lose your money.

The only reason why I am making my portfolio public because it provides accountability to me. Some or all the analysis I provide could be from the top of my head and should not be considered accurate.

My investing goal is simple; to try to manage risk while being fully invested without market timing. Howard Marks said it best, “even though we can’t predict, we can prepare.”

All my references to the Market are only for the US Market.

Performance

During Q1 of 2023 my portfolio returned 0.79% compared to 7.5% for the S&P 500 (with dividends reinvested).

The table below is a breakdown of my portfolio at the end of Q1 2023. What you see below where my entire net worth, excluding my home, is allocated. Lastly, my 401k is 100% invested in a Small Cap Value Fund.

Company%
AIMFF3.7%
AVDE0.2%
AVDV0.7%
AVES0.9%
AVIV0.5%
AVSC0.0%
AVUV0.6%
BAC2.7%
BRK.B14.5%
BSBK0.1%
BTI1.5%
BWFG0.0%
C1.4%
CFSB0.1%
CLBK0.0%
COF1.0%
CSV7.2%
CULL0.1%
DFEV1.0%
DFIC0.6%
DFIV0.6%
DFSV0.5%
DISV0.6%
EPD2.8%
EWUS0.0%
FFBW0.3%
FPI0.0%
FSEA0.1%
GVAL2.6%
HII0.6%
INTC0.8%
IVAL0.3%
LAND0.0%
LMT0.5%
MKL4.7%
MMP3.9%
MU8.1%
NECB0.2%
PBBK0.1%
PREKF0.8%
TCBC0.1%
TCBS0.1%
USB0.5%
WMPN0.1%
  
T Bills8.3%
Gold3.3%
Platinum0.8%
Farmland4.0%
I Bonds7.4%
Cash1.8%
401k9.2%

Below is a breakdown by category:

Bonds7.38%
Cash1.80%
Conglomerate14.49%
Defense1.09%
Financials7.00%
Funeral7.21%
Insurance4.74%
International8.01%
Manager3.71%
Oil/Gas7.50%
Precious Metals4.06%
Real Estate4.01%
Semiconductor8.87%
Small Cap Value10.31%
T Bills8.29%
Tobacco1.51%

Commentary

The only change I made to the portfolio was I started a small position in Capital One. My buy price was essentially at tangible book value. I initiated the position during the bank collapse SVB Bank.

In terms of going forward I don’t have any view. I know the Market is very bearish and I can understand why. I still think the economy is doing well; everywhere I go I see people spending money. It is concerning that it looks like white collar jobs are being eliminated and I don’t see how in the long term this doesn’t have a negative impact on the economy 6-12 months from now.

With gold at around $2,000 it is tempting to sell my gold and buy Treasury Bills with the money but if the economy doesn’t do well then gold may have more room to run. Also, I don’t need to sell the gold which means I’ll let it run.

Below are charts and quotes I enjoyed during Q1 this year:

“At this juncture, you can either invest based on a belief in business cycles and normalization or invest based on faith that the economy can be successfully managed forever.” Source: Q4 letter from https://www.palmvalleycapital.com/fundletter 

“In our view, these historical patterns not only suggest a low probability of loss for small-caps over longer-term periods of at least three years, but they also imply that the opportunity cost of waiting or trying to time a bottom—whether for the market or the economy—may be high. So while no one can predict future outcomes for the markets or the economy, we can carefully examine small-caps’ past performance patterns in a way that helps us make sense of the present as we prepare for the uncertain days ahead.”https://www.royceinvest.com/insights/small-cap-recap#:~:text=Small%2DCap%20Value%20and%20Quality,%25%20in%204Q22%20versus%204.1%25

Source: https://mcusercontent.com/6750faf5c6091bc898da154ff/files/dc684782-596c-6e2c-4181-39c56492025e/20230108.IF.1Q23GTM.JPM.pdf

Source: https://www.gmo.com/americas/research-library/memo-to-the-investment-committee-a-hidden-gem/

“Today (January 30, 2023), deep value companies in Europe can be purchased at around 5x EV/EBITDA and 0.8x Price/Book, based on data from S&P Capital IQ. If firms in that category prove to be more resilient than the pessimistic expectations embedded in their prices would imply, they could significantly benefit from multiple expansion over time and still avoid looking expensive. And while waiting for the fruits of mean reversion, we believe investors in European deep value companies can benefit from cash distributions in the form of dividend yields around 4%, share buybacks, and deleveraging.”

Source: https://mailchi.mp/verdadcap/after-the-darkest-hour-comes-the-dawn?e=e1c5773556

Source: https://mcusercontent.com/39fb26a63194ed9f3f9058ea7/files/fbbac38c-54c5-8542-042a-d668639cfdcd/Templeton_Phillips_2022_Letter_Public.01.pdf

“Annual gold demand increased 18 per cent last year to 4,741 tonnes, the largest amount since 2011, driven by a 55-year high in central bank purchases, according to the World Gold Council, an industry-backed group.”

Source: https://www.ft.com/content/ef6ed550-422a-4540-a8af-41ff2ac30e67

“[Meanwhile] stocks are caught between a rock and hard place. Strong nominal growth (either via inflation or real gains) will force the Fed to hold rates higher and tighten financial conditions further…. A worst scenario is an outright recession, with falling earnings, sentiment, and growth.”

Source: https://thelastbearstanding.substack.com/p/has-the-rally-peaked

“As of this writing, the S&P 500 is at $3,850 and earnings estimates for 2022 are around $200. This means that the average stock in this index is trading at approximately 19x earnings, which is a high number, especially in the current rising-interest-rate environment, but not insane (the historical average is around 15x).

Currently, profit margins are 11.5%, down from 12.1%, which was an all-time high just a few months ago. Over the last 75 years, corporate profit margins have averaged about 7.1%. Over the last 30 years profit margins were 8.2%. In the 1980s, profits averaged 5.3%, in the 1990s 5.7%, and in the first decade of the century they were 7.9%. If profit margins settle at the level of the past decade, at 10.2%, then the market will be trading at about 22 times earnings. If margins return to their former levels, we may find that the earnings power of the S&P 500 is $91-$143 per share, or in other words, stocks are trading 27-42 times earnings.”

Source: https://contrarianedge.com/stock-market-roller-coaster-prepare-for-a-decade-or-two-of-disappointing-returns/

“For value investors, the above findings are good news, as the largest historical drawdown for the value premium from November 2016 through October 2020 led to a dramatic widening of the book-to-market spread between value and growth stocks. Even with the strong performance of the value premium since then, the spread is still much wider than its historical average and much wider than it was when Eugene Fama and Kenneth French published their famous study “The Cross-Section of Expected Stock Returns” in 1992. Thus, the expectation is that the value premium will be larger than its historical average.

Source: https://alphaarchitect.com/2023/02/dark-winter-value-stocks/

Source: https://www.nathanielbullard.com/presentations

“Further, we see no reason that smaller companies should fare as poorly this decade as they did in the past one. We would argue that the current P/E discount for smaller stocks suggests a reversal is more likely than a continuation, which should benefit Oakmark Select more than Oakmark.”

Bill Nygren https://oakmark.com/news-insights/why-we-still-believe-in-concentrated-investing/

“Going forward: in prior research, we’ve laid out what we think is a reasonable path to equilibrium. In a nutshell, we see it looking something like this.

  • To get 2% inflation, you need a deceleration in wage growth from the prior 5% to about 2.5%.
  • To reduce wage inflation, you need to cut nominal spending and income growth in half to 3-5% and raise the unemployment rate by 2% or more.
  • To raise the unemployment rate, you need to drive nominal GDP growth materially below wage growth and compress profit margins enough to produce about a 20% decline in earnings.
  • After that, you need to hold short-term interest rates steady for about 18 months, until 2.5% wage growth, 2% inflation, and 2% real growth are sustainably achieved.
  • Then cut short-term interest rates to about 1% below then-existing bond yields.”

Source: https://mcusercontent.com/6750faf5c6091bc898da154ff/files/136d8eba-44ac-9569-c44b-97f7fe694ff9/CS_YB_summary_edition_2023.pdf

Posted in Investing | Leave a comment

2023 $250 12-Team Mixed NFBC Draft Recap

This draft took place at 5pm PST on March 27.

League Background

This is a 12-team mixed NFBC draft. The roster consists of 14 hitters, nine pitchers and seven bench players. You set your pitchers once a week; hitters are set twice a week; waivers occur once a week.

Below are the results:

PlayerRoundPickPos
Ronald Acuna Jr.12OF
Daulton Varsho223C
Will Smith326C
Zack Wheeler447P
Tim Anderson550SS
Zac Gallen671P
Yu Darvish774P
Nathaniel Lowe8951B
Tyler O’Neill998OF
Pete Fairbanks10119P
Nico Hoerner11122MI
Masataka Yoshida12143OF
Ryan McMahon131463B
Riley Greene14167OF
Ramon Laureano15170OF
Jean Segura161912B
Alex Lange17194P
Josh Naylor18215CI
Jorge Polanco19218UT
Jon Gray20239P
Austin Meadows21242OF
Marcus Stroman22263P
Sean Manaea23266P
Aaron Civale24287P
Yandy Diaz252903B
Eric Lauer26311P
Joe Jimenez27314P
Mitch Keller28335P
Nick Pivetta29338P
Erik Swanson30359P

Below is my analysis of some of the players I drafted. There will be a lot overlap between the analysis of my first draft.

Trea Turner was my number one player because he is a true five category player. Ronald Acuna has the most upside but Turner provides a .290ish batting average floor while Acuna’s floor is maybe .250’s.

With catching thin I thought it was necessary to get Daulton Varsho, my number one catcher for two years in a row. Other than batting average he should provide good production everywhere else. The biggest question mark is how much will he be platooned? His saving grace is he is a really good defender, which means he will play more than not. If Varsho was outfield-only he would be my 27th outfielder. I rated Will Smith ahead of J.T. Realmuto because Smith provided more power. When doing my draft matrix I realized speed was easier to acquire than power. Between Varsho and Smith I think I’ll get 52 home runs and 15 stolen bases from my catchers.

Zach Wheeler was the best starting pitcher available.

Tim Anderson was choosen for his batting average.

Zac Gallen and Yu Darvish were the best pitchers available. I would have preferred a closer but there weren’t any good ones worth taking in the 7th and 8th rounds.

I liked Tyler O’Neil last year and I am believer again. He’s still only 27 years old and the raw ingredients are there. If he can stay healthy I see 25/15 with a lot of RBIs. The one downside is since he is playing center field his stolen bases may decrease but the fact the Cardinals have made Dylan Carlson their fourth outfielder means they believe O’Neil can handle the defensive requirements.

Nate Lowe and Josh Naylor should give me a combined .270 average with 45-50 home runs. There are seven pretty good first basemen and Lowe is number seven. C.J. Cron was a consideration but the back problems he had in Spring Training had me worried. I have no idea why there isn’t as much love for Naylor. I think his output will be similar to Andrew Vaughn but Vaughn goes 80 picks ahead of Naylor.

I know the Rays will mix and match the closer role but I’m betting Pete Fairbanks ends the season with 20-25 saves. He’s the best pitcher in the bullpen but that doesn’t mean anything for saves. This pick could be really bad for me.

Mastaka Yoshida should hit for a high batting average with enough power and accounting statistics to be useful. By missing out on Trea Turner I needed to find batting average guys to make up for my low batting average guys like O’Neil and Laureano.

Nico Hoerner maybe has an 80 hit tool. He recently signed a 3-year extension and should leadoff everyday. I’m expecting a high .270s batting average with 10/20 with maybe 90 runs scored. After 10 games he will get second base eligibility too.

When doing my draft matrix I saw there wasn’t much value left at third base (in the 13th round and beyond) if you wanted home runs and a batting average above .240, which is why I targeted and choose Ryan McMahon. I’m projecting 23 home runs but his exit velocity in Spring Training suggests there may be more power this year.

Riley Greene is someone who could go 25/15; granted that may come with a .250 batting average but the upside is worth it here.

Ramon Laureano is probably the Athletics best hitter. If he struggles he’s going to continue to play because they don’t have anyone better. If he plays a full year I think 20/20 is possible. That may come with a .235 batting average but that is why I drafted guys like Benintendi and Hoerner.

Jean Segura is the fantasy baseball equivalent to rolled oats. He will probably hit .280 with 10/10 and enough counting statistics to matter. He is just a solid player all around.

Alex Lange probably remains the closer all year but is the team good? He has average stuff so the ratios won’t be that good but I am banking on he’s just good enough to hold down the job all year.

I owned Jon Gray last year and I think his numbers didn’t show how good he was. In other words, he was unlikely. He still plays in a good pitching park and has a very good infield defense behind him.

If Jorge Polanco gives me 500 at-bats then I got a tremendous bargain. He’s only 29 years old so the recovery process of the knee should be pretty quick. As of March 28 he is going through baseball activities without limitations. If he played a full year I projected .264 with 22 home runs with 80 RBI and 80 runs with 4 stolen bases.

Every year the Market forgets about productive players two years ago who had a down year one year ago. A couple of years ago that moniker went to Eduardo Escobar and Mitch Haniger. I believe Austin Meadows could fit into this category. After an injury plagued season Meadows had an ADP of 272 at NFBC. Meadows has a similar ADP of Austin Hays. I like Hays but the odds of Hays dramatically outperforming his ADP is small compared to Meadows.

The Giants asked Sean Manaea to go to Driveline in the offseason and his velocity in Spring was 2 mph faster. Will it stick? I have no idea but I’ll take any pitcher playing their home games in San Francisco. I get Mitch Keller every year thinking this is the year he breaks out. Is this the year he breaks out? Probably not, but the upside is too good pass. His first start is in Cincinnati so I probably will not learn very much. Joe Jimenz may be the Braves closer or at least in a time share. With the first week consisting of four days I wanted relievers so I could hopefully get some cheap strikeouts during the shortened week. Erik Swanson is a good reliver for the shortened week and could be valuable if Jordan Ramano gets hurt. Nick Pivetta was selected because in week two he starts against the Pirates. No one wanted Yandy Diaz and I don’t know why. He will have first and third eligibility and Roster Resource has him leading off. If he leads off all year he could have 85-90 runs considering his .370s OBP. The price is so cheap Diaz was worth taking even if he’s on my bench.

Posted in Fantasy Baseball | Leave a comment