
Disclaimer
Nothing discussed/written should be considered as investment advice. Please do your own research or speak to a financial advisor before putting a dime of your money into these crazy markets. In other words, if you buy something I bought, you deserve to lose your money.
The only reason why I am making my portfolio public because it provides accountability to me. Some or all the analysis I provide could be from the top of my head and should not be considered accurate.
My investing goal is simple; to try to manage risk while being fully invested without market timing. Howard Marks said it best, “even though we can’t predict, we can prepare.”
All my references to the Market are only for the US Market.
Performance
For the year this far my stock portfolio was down 23.8% compared to a negative 18.11% for the S&P 500 (with dividends reinvested).
Commentary
Unfortunately I deleted my lengthy article (with a ton of charts) but the gist of it was Small Cap Value and Emerging Market Value was incredibly cheap. One chart showing how cheap Value is from AQR.
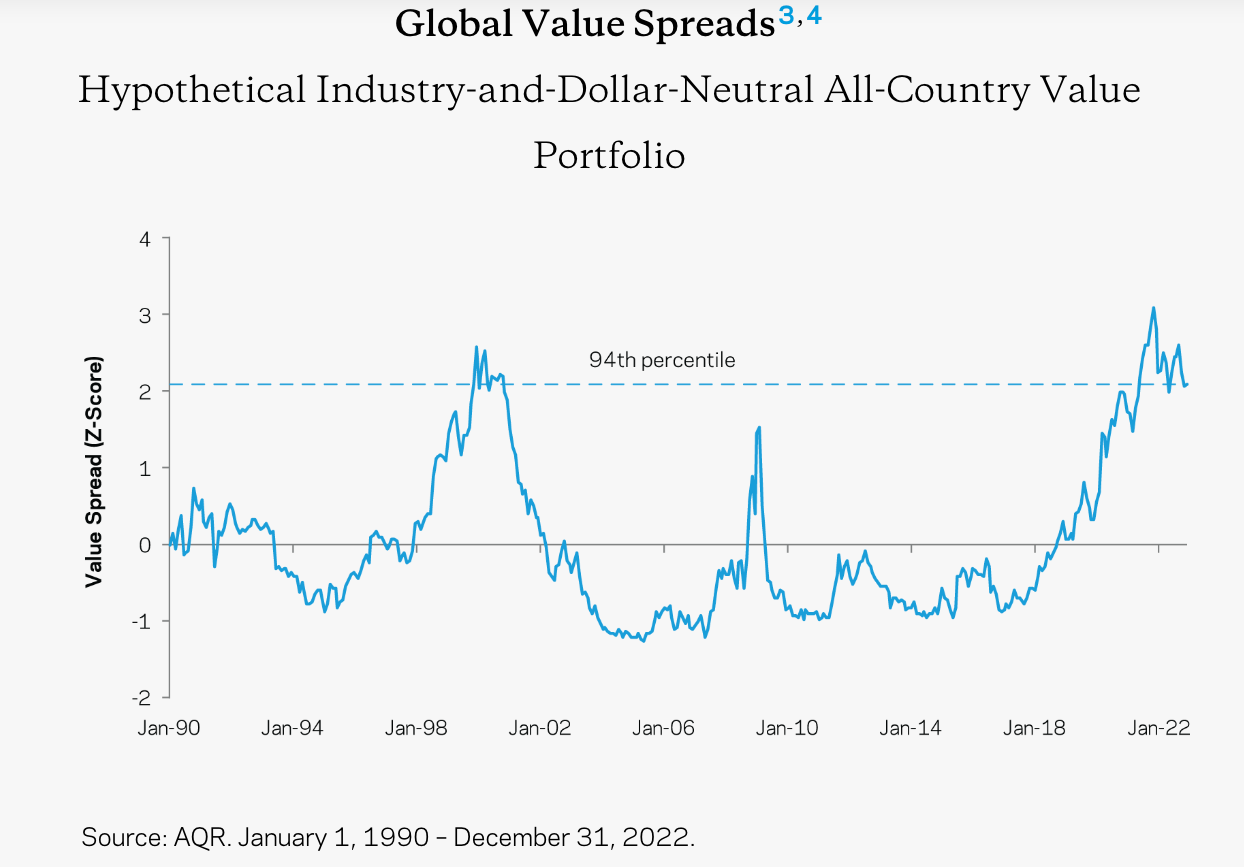
The TLDR of all the charts you would have seen led me to conclude that I was too defensive with my cash/Treasury Bills holdings and I should start deploying some of it.
The one major change was I trimmed my Altria position and put the money into British American Tobacco. On a cost basis both positions are equally weighted from a cost basis.
The table below is a breakdown of my portfolio at the end of 2022. What you see below where my entire net worth, excluding my home, is allocated. Lastly, my 401k is 100% invested in a Small Cap Value Fund.
| Company | % |
| BRK.B | 14.6% |
| CSV | 7.1% |
| MU | 7.1% |
| MKL | 4.8% |
| AIMFF | 3.8% |
| MMP | 3.6% |
| BAC | 3.6% |
| EPD | 2.6% |
| MO | 1.8% |
| GVAL | 1.8% |
| EQC | 1.6% |
| BTI | 1.6% |
| JBAXY | 1.1% |
| C | 0.9% |
| PREKF | 0.8% |
| HII | 0.7% |
| INTC | 0.6% |
| DISV | 0.6% |
| DFIC | 0.6% |
| DFIV | 0.5% |
| AVIV | 0.5% |
| AVES | 0.5% |
| LMT | 0.5% |
| FFBW | 0.3% |
| AVDV | 0.2% |
| AVUV | 0.2% |
| NECB | 0.2% |
| AVDE | 0.2% |
| TCBC | 0.2% |
| WMPN | 0.2% |
| CULL | 0.2% |
| PBBK | 0.1% |
| BSBK | 0.1% |
| TCBS | 0.1% |
| FSEA | 0.1% |
| CFSB | 0.1% |
| AVSC | 0.0% |
| EWUS | 0.0% |
| BWFG | 0.0% |
| DFSV | 0.0% |
| CLBK | 0.0% |
| LAND | 0.0% |
| FPI | 0.0% |
| T Bills | 12.0% |
| Gold | 3.1% |
| Platinum | 0.8% |
| Farmland | 4.1% |
| I Bonds | 7.5% |
| Cash | 0.6% |
| 401k | 8.2% |
Below is a breakdown by category:
| Bonds | 7.54% |
| Cash | 0.58% |
| Conglomerate | 14.63% |
| Defense | 1.18% |
| Financials | 7.28% |
| Funeral | 7.08% |
| Insurance | 4.84% |
| International | 4.94% |
| Manager | 3.76% |
| Oil/Gas | 7.07% |
| Precious Metals | 3.92% |
| Real Estate | 5.69% |
| Semiconductor | 7.69% |
| Small Cap Value | 8.48% |
| T Bills | 11.98% |
| Tobacco | 3.34% |


