
Disclaimer
Nothing discussed/written should be considered as investment advice. Please do your own research or speak to a financial advisor before putting a dime of your money into these crazy markets. In other words, if you buy something I bought, you deserve to lose your money.
The only reason why I am making my portfolio public because it provides accountability to me. Some or all the analysis I provide could be from the top of my head and should not be considered accurate.
My investing goal is simple; to try to manage risk while being fully invested without market timing. Howard Marks said it best, “even though we can’t predict, we can prepare.”
All my references to the Market are only for the US Market.
Performance
For the year this far my stock portfolio was down 20.02% compared to a negative 20.25% for the S&P 500.
Market Commentary
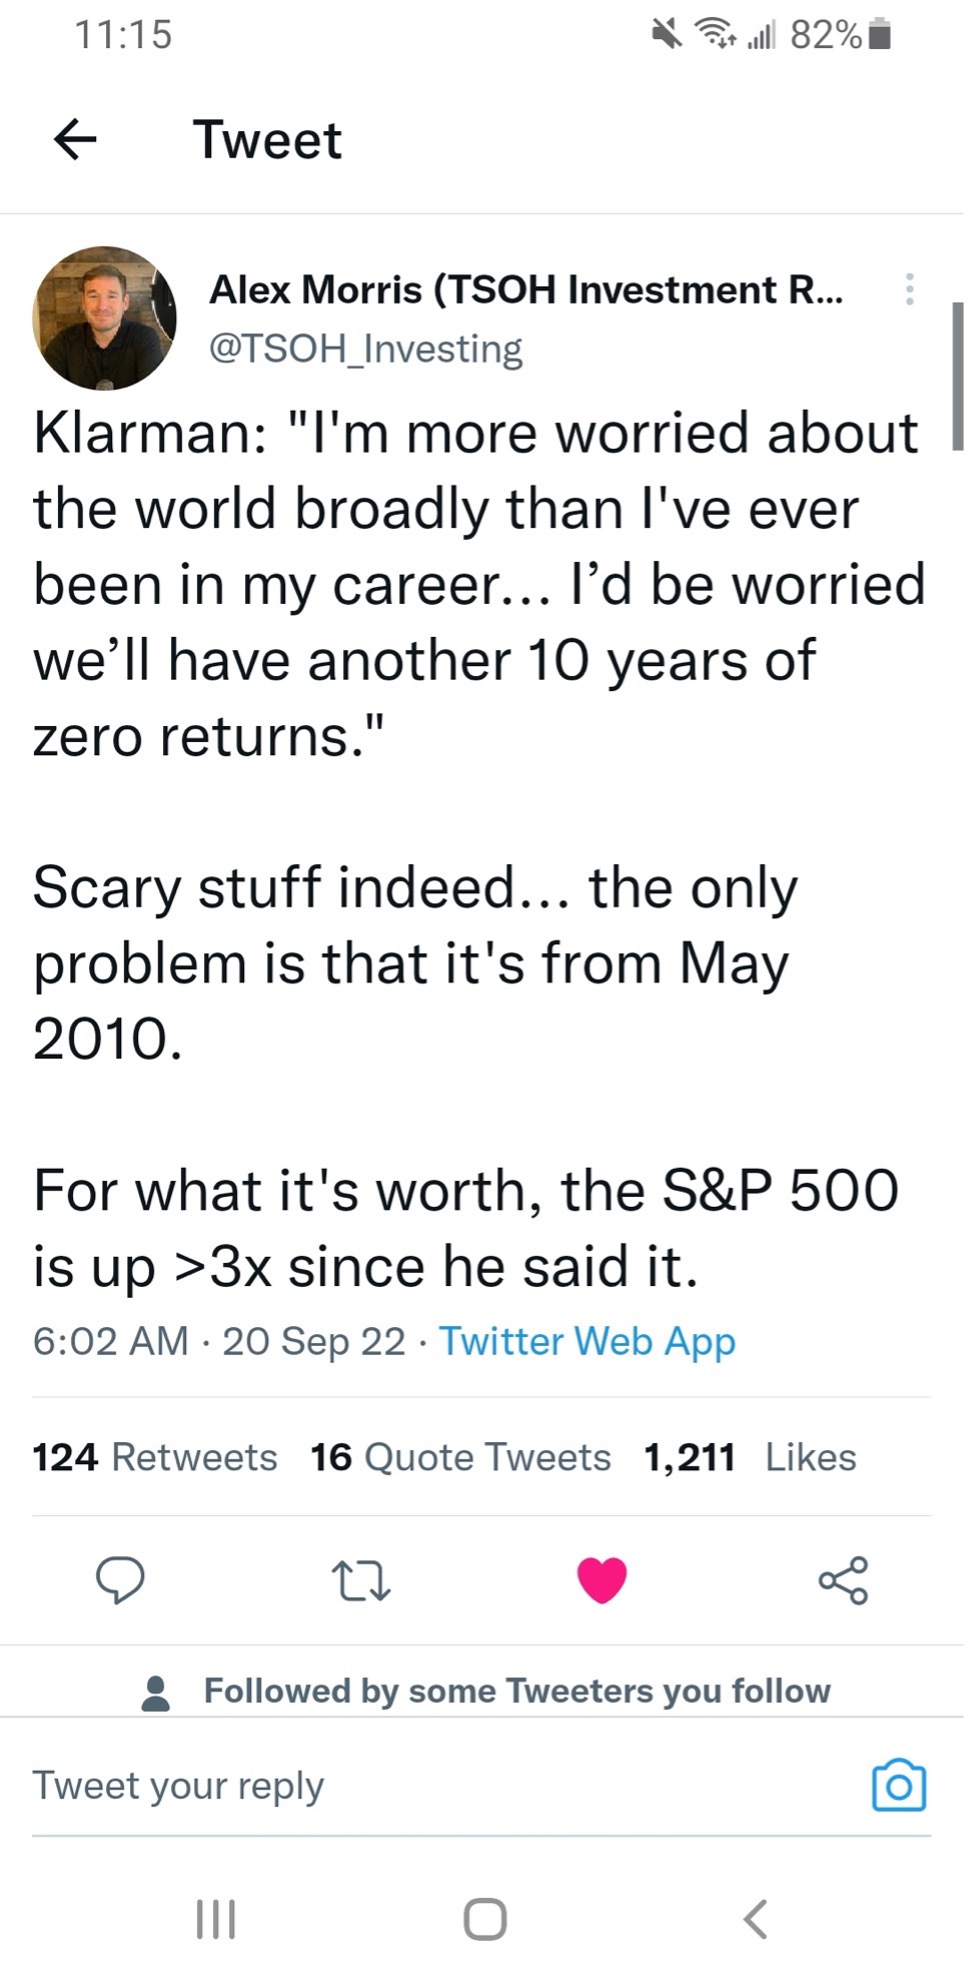
Markets are in turmoil. Bonds haven’t sold off this much since 1949. The US stock market is down roughly 20%. What is one to do? I love the tweet from The Science of Hitting. In 2010 markets and the economy was a scary place and Seth Klarman was very pessimistic about the future prospects. But what ended up happening was the US stock market increased three-fold.
I’m still new to investing and I’m not feeling any panic at all. It doesn’t really make sense to panic, right? First, the economy is totally out of my control and there’s nothing I can do about it. Second, other than one company I’m happy with the collection of businesses I own.
The big question I have as a long-term investor with cash should I deploy that money now? Should I wait? Let’s try to find some answers.
What’s the value of the S&P 500?
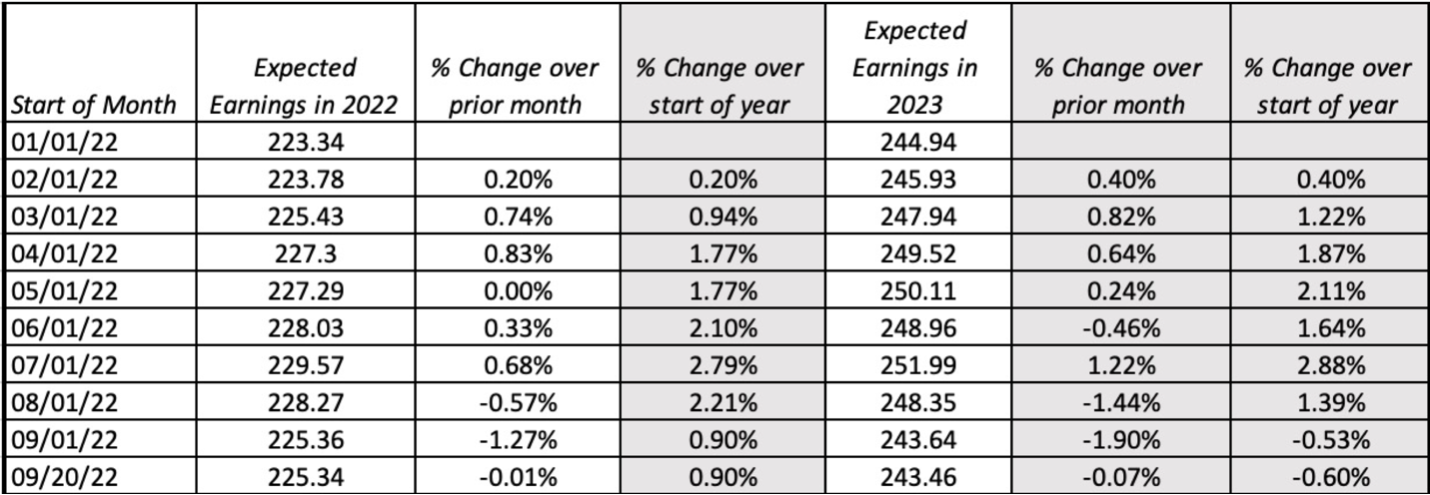
Below is a timeline of the expected 2023 earnings of the S&P 500 by analysts. As of September 20 they still think earnings will be the same as they thought on January 1.
Source: https://pages.stern.nyu.edu/~adamodar/pdfiles/blog/InflationUpdate.pdf
“During normal economic times, analysts are roughly correct with their forward earnings predictions. However, at economic inflection points, estimates miss the mark badly. In the chart (below), we highlight recessions (shaded blue). Heading into a recession, analyst estimates overshoot the target. Coming out of a recession, analysts are too slow to boost forward earnings estimates.” Source: https://mcusercontent.com/6750faf5c6091bc898da154ff/files/c9237d02-769a-a350-3fa8-24b9a78b88b0/dippingToe_edited_1_.pdf
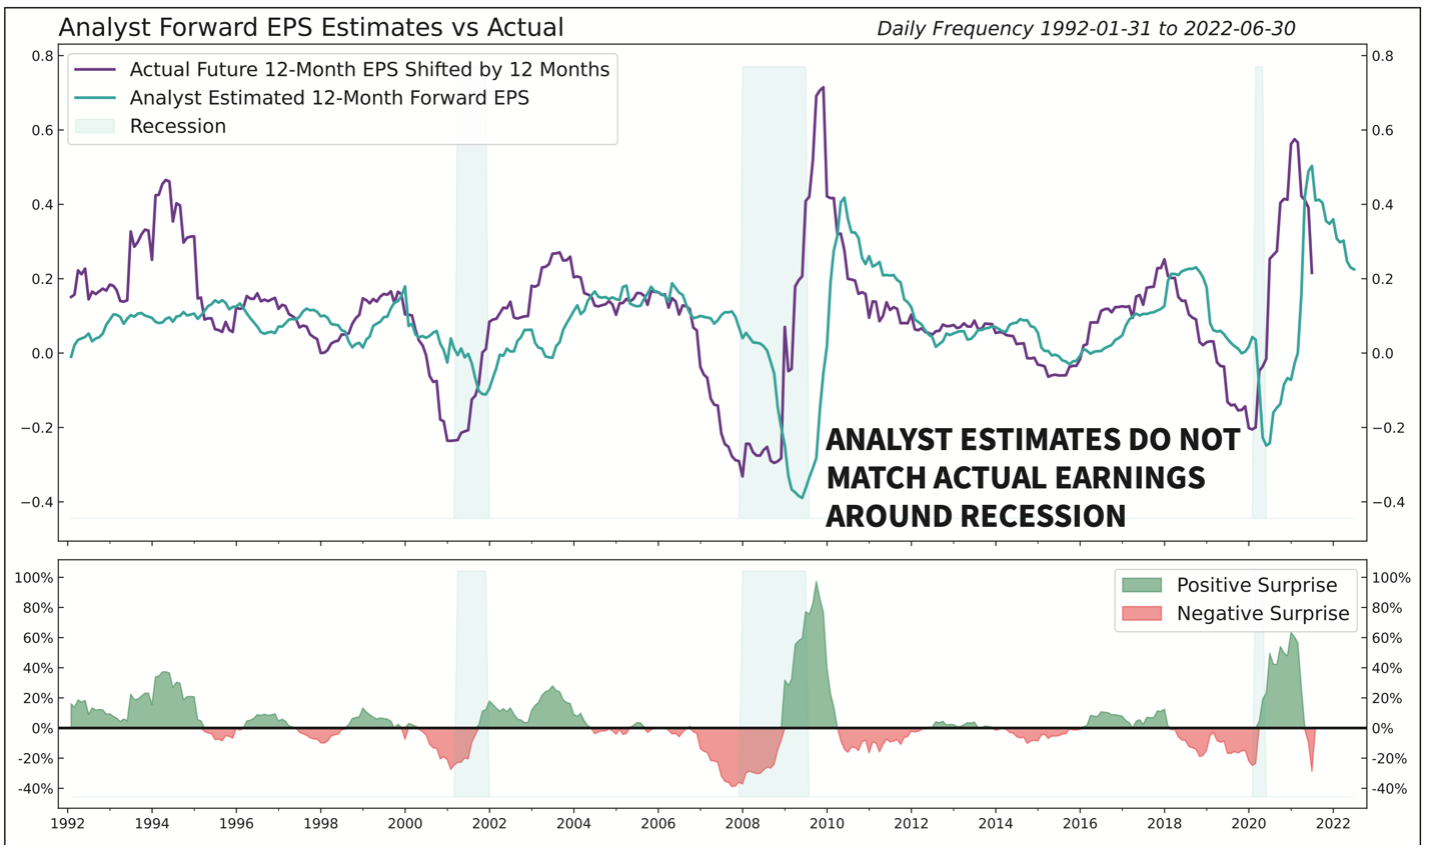
The chart above shows that analysts tend to be lag actual earnings before and after a recession. Therefore, I think earnings of the S&P 500 will be lower than projected. How much lower? 10%? 20%? At this point it’s a guess. Aswath Damodaran thinks earnings will drop by 15%. That sounds reasonable to me. He estimates fair value for the S&P 500 is 3,516 which is about where the S&P sits at the close on September 30.
Should I be buying stocks right now?
“Can history help us decide how we should invest in a bear market? Over the 77 years for which we have daily price data for the S&P 500, there have been 12 bear markets. Let’s look at the previous 11. The median bear market low occurred 117 days following the day the market was down 20%. The shortest time to the ultimate bottom was one day after falling 20%, which occurred in October 1957. The longest was more than two years, September 1946 to June 1949. If this bear market behaves like its predecessors, it is a coin-flip whether it bottoms by October.
What were equity returns immediately following bear markets? For the 11 previous bear markets, the median additional decline after the market was down 20% was another 10% loss. Despite those declines, two years from the time the market first hit down 20%, the median gain was 33%. That statistic is especially interesting because the two-year price increase from a random purchase date has been just over half as much, 17%. Perhaps the advisors who are now urging extra caution are being driven by their emotions rather than data.” Source: https://oakmark.com/news-insights/bill-nygren-market-commentary-2q22/
“The bad news is that judging from history, everyone is correct that we could see more downside in the short term. Once the market dropped 20%, there was an average additional downside in the mid-teens percentages. That roughly brings us to 3300 on the S&P 500, ~13% downside from where we currently sit (3,785). It could take approximately 2-4 months to reach that point.
Most of the time, longer term returns from here are strong! Once you have a 20% drawdown, based on historical performance, you have high odds of earning strong returns over the next 1, 3 and 5 years! On average, the market gains 16% over the next year and 13% annually over the next 3-5 years (including any additional losses).” Source: https://millervalue.com/pleasing-for-the-long-term/
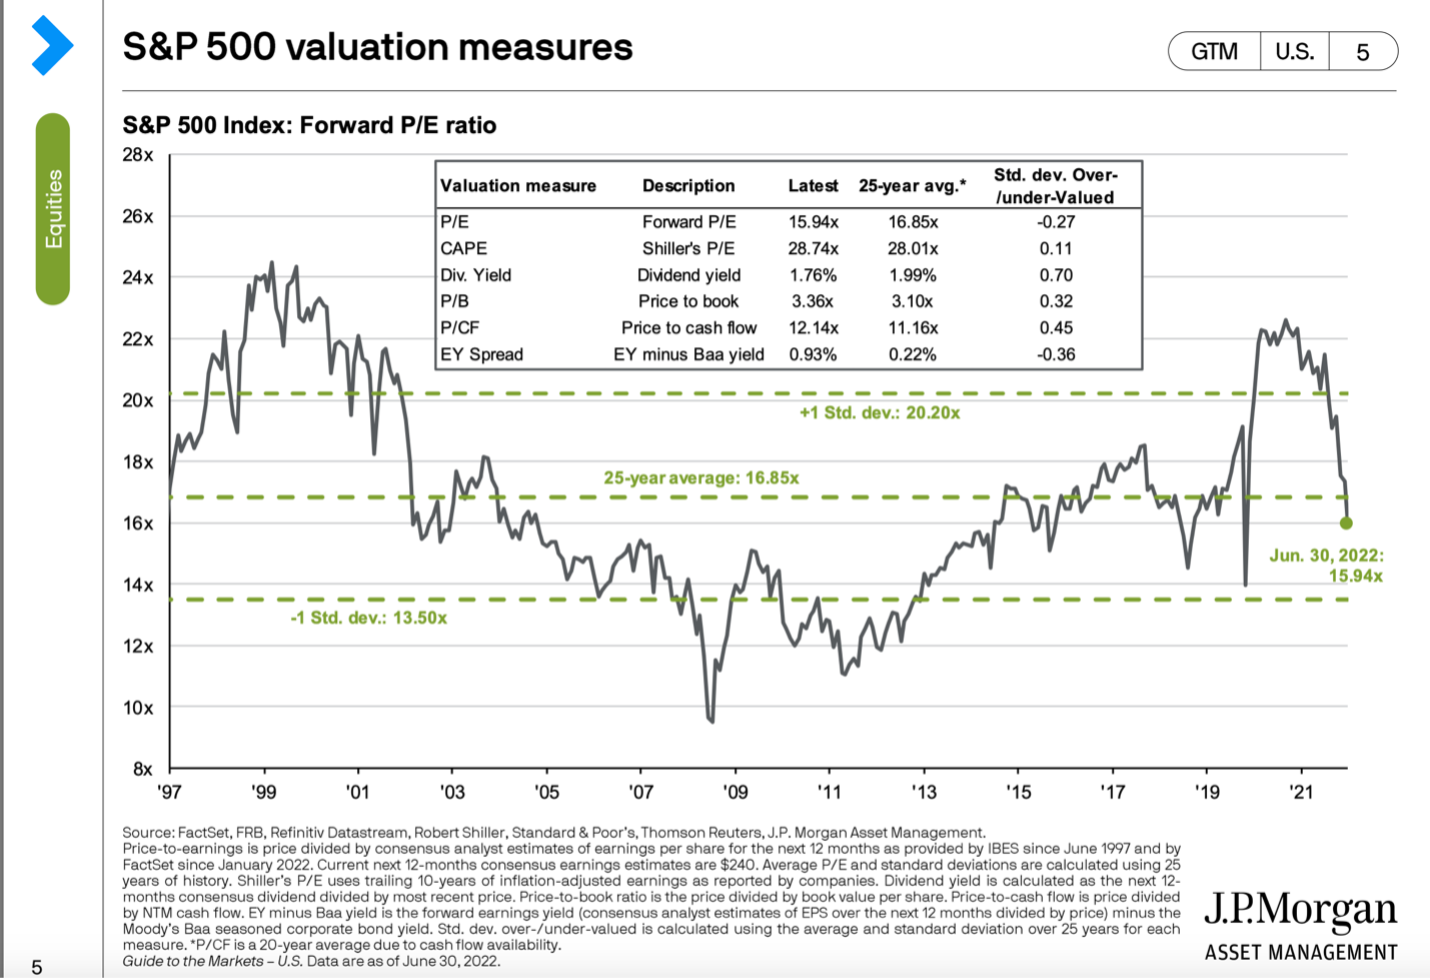
Below is a chart from J.P. Morgan Asset Management. The chart is for June 30 but the S&P now is roughly at the same level now as June 30.
Lastly, I understand the base rates that I just cited from professional money managers. However, on September 28 the UK central bank essentially said they were going to do QE and the Market rallied. But the next two days stocks and bonds declined dramatically. That indicates that the Market no longer cares about QE being a catalyst for stocks and bonds, which implies that even in the US Federal Reserve did QE again that the Market would reject it.
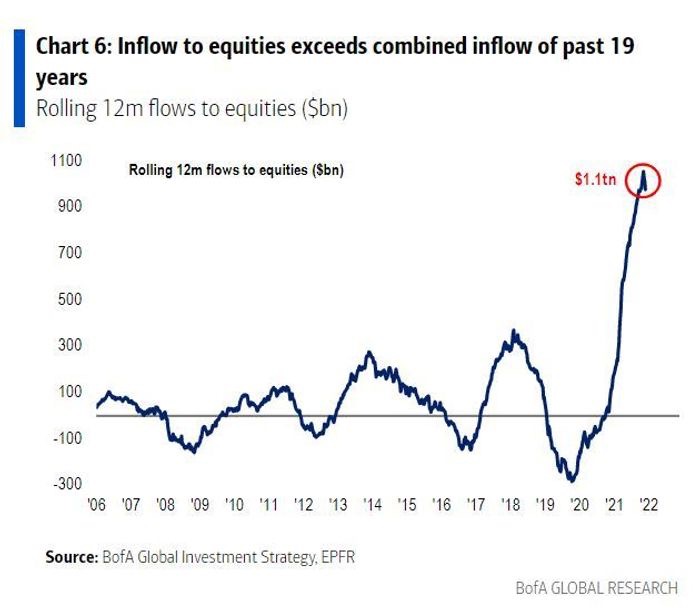
Take a look at the amount of inflows into the US stock market in 2021 (image below). It’s literally more than the previous 18 years combined! I think Ken Fisher said in one of his books that in a bear market one third of the drawdown occurs in the first one third of the time and two thirds of the drawdown occurs in the last one third of time. With so much dead/dumb money in the US market its entirely fathomable that the Market decreases dramatically.
Even if 3,516 for the S&P 500 is fair value, markets tend to swing like a pendulum, which means it’s very likely if a lot of bad news occurs that that the Market will overcorrect to the downside. Palm Valley Capital recently wrote, “In our opinion, investors believing the worst is behind them are neglecting the extraordinary heights asset prices and policy extremism reached during the current cycle. Market cycles that soar over 600% from their lows and reach valuation metrics rarely seen typically do not end with a wimpy 19% decline from all-time highs.”
What if I’m wrong? What if the Market is basically at its lows and I don’t deploy my cash? How would I feel in that scenario? I would be happy.
However, how do I hedge myself? I remember the adage of its better to have time in the market rather than timing market. Therefore, I am going to buy equities after a pay period (minus my expenses). To be clear this will be a couple of hundred of dollars so it’s very small overall.
Despite the base rate of good performance in the long term after a drawdown we are having, the reason why I am hesitant to deploy my money now is because my life won’t meaningfully change if that base rates hold up. However, if this is a 2008/1929 scenario, the ballast my cash provides will dramatically improve my ability to hold on psychologically. As the saying goes, going through a bear market without cash is painful.
What is worth buying? In other words, what looks cheap?
Jason Zweig recently recommended international stocks. “Now international currencies, and stocks, are simultaneously depressed relative to the U.S. If the dollar ultimately declines from its recent record highs, that drop would give a double boost to the returns on overseas stocks. I can’t tell you when that will happen, but I think it probably will.” Source: https://www.wsj.com/articles/international-stocks-investing-analysis-11663340128
Mr. Zweig has a point particularly in regards to Europe and in South Korea. The latter (ticker symbol EWY), is selling for less than pre-Covid. In terms of Europe, I understand they have a major issue with energy this coming winter but what if the war in Ukraine ends next week? Or if this winter is a relatively warm one?
GMO recommends Emerging Markets Value (image below).
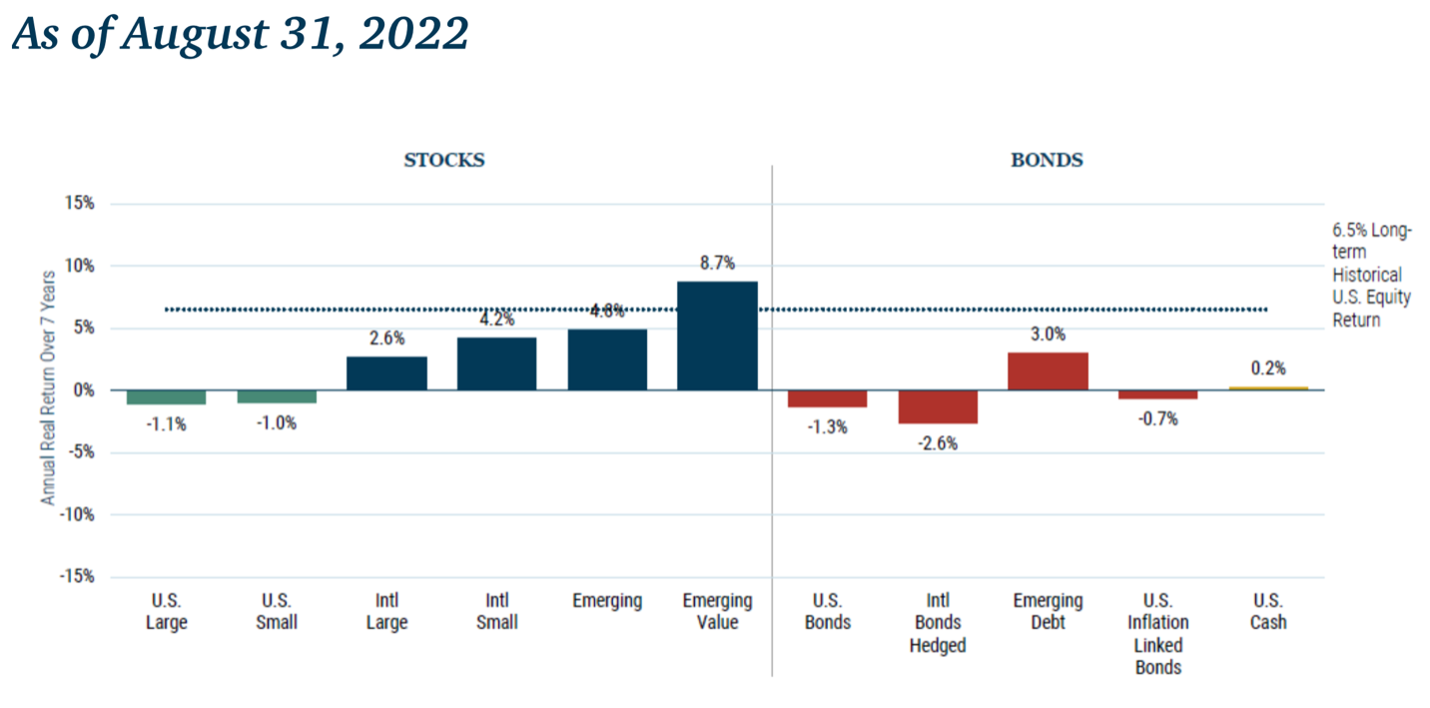
However Verdad recently wrote, “In conclusion, investing in EM (emerging markets) is far from being a “no-brainer” for US investors. The volatility in high-yield spreads and across asset classes reflect a heightened risk in those regions. EM crises, which tend to be more frequent and more severe, are often accompanied by liquidity crunches and EM currency devaluations. And while foreign investors might be compensated for the risk of a market crash, as suggested by returns in local currencies, there seems to be no compensation for the ubiquitous risk of a currency crash. Until those risks are mitigated, we see no compelling reasons for an evergreen allocation to EM. However, EM equities perform particularly well during recoveries, when currencies stabilize and earnings and multiples rise. These are the same tailwinds that US value investors experience. Therefore, the same contrarian investors willing to bet on US value stocks during panics (i.e., at the beginning of recoveries) can reap additional rewards from a concurrent bet on EM value stocks.”
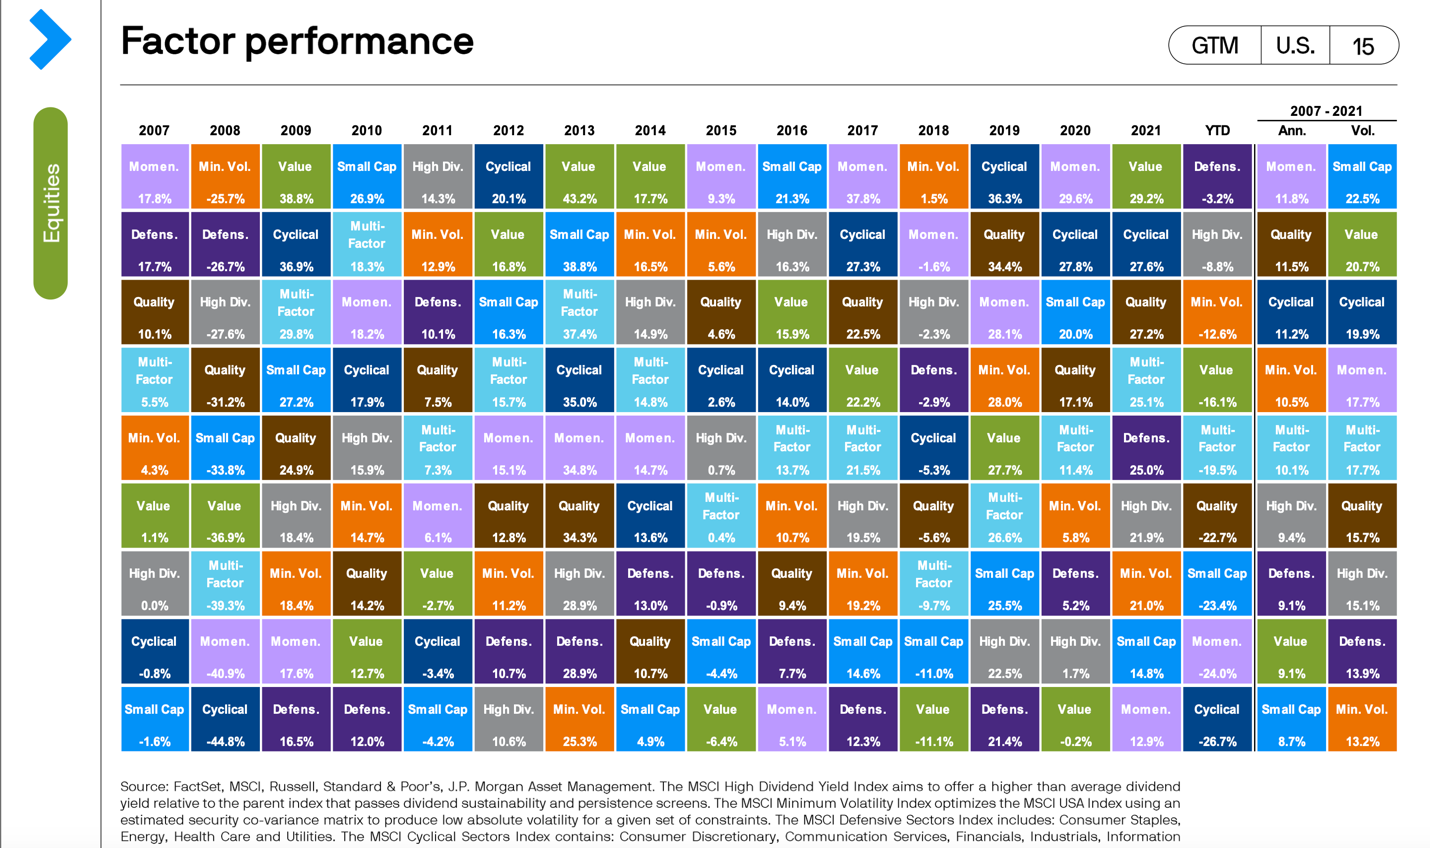
Below is a history of performance for different factors provided by J.P. Morgan Asset Management. The data is as of June 30, 2022. It looks like two factors are the best coming out economic turmoil and recessions: Small Cap and Value.
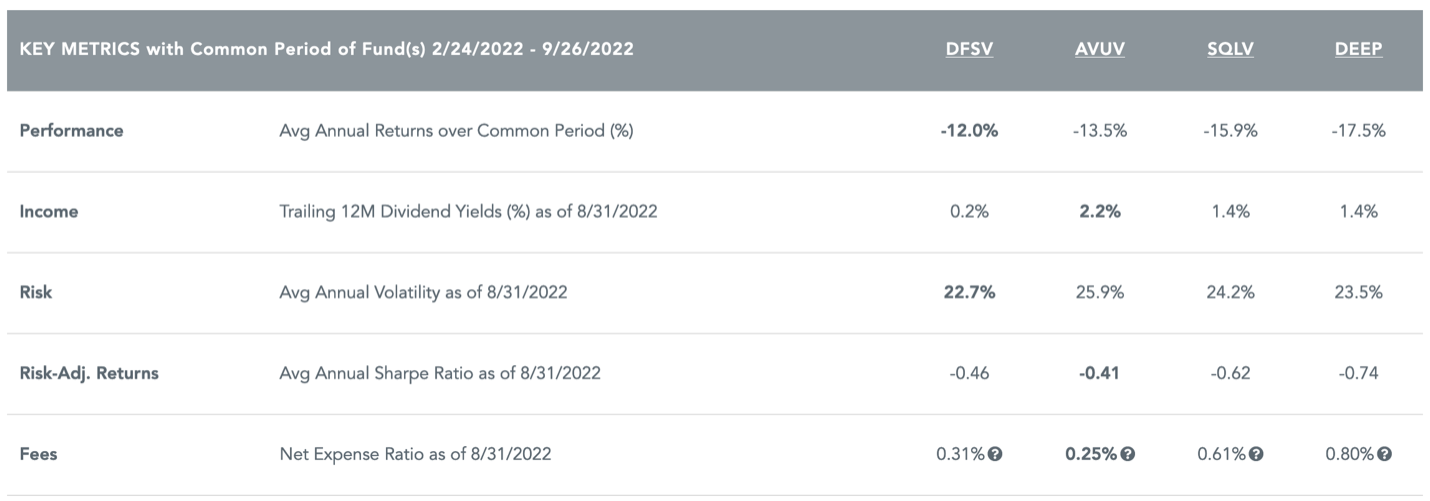
In terms of small cap value funds these look the most interesting to me:
- SQLV: Royce Quant Small-Cap Quality Value ETF
- AVUV: Avantis U.S. Small Cap Value ETF
- DFSV: Dimensional US Small Cap Value ETF
- DEEP: Roundhill Acquirers Deep Value ETF
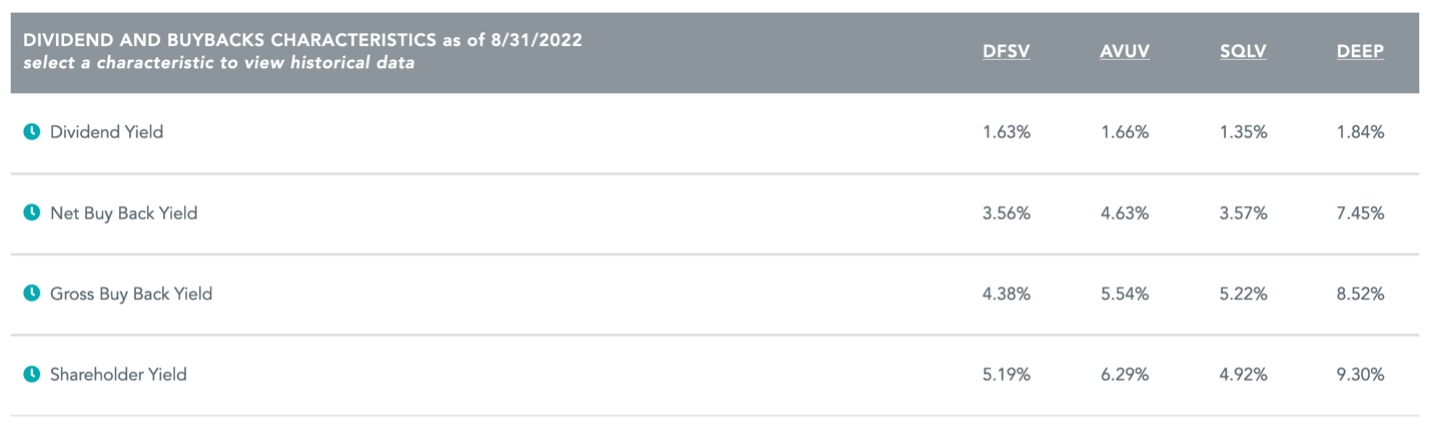
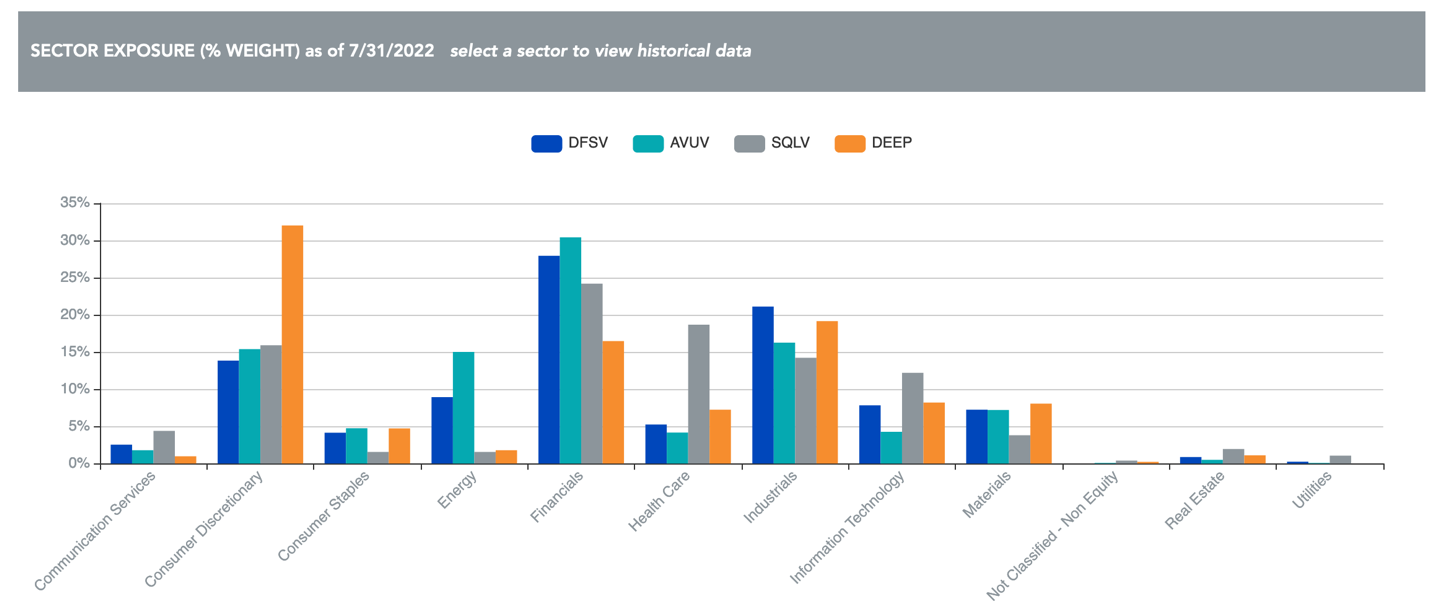
Wisdom Tree has a great tool for comparing ETFs. Below are some screenshots of the tool.
Among the value ETFs I have made an allocation to is Davis Select Financial ETF (DFNL). Financials as a sector that is extremely cheap. I’ve long admired Christopher Davis and he understands the financials sector much more than me.
The Big Question: when should I deploy my capital?
Brief background about my current state. I have a year’s worth of expenses in cash; specifically, I Bonds. I roughly have 10% of cash available to be deployed. I also have about an additional 7% in physical metals (gold and platinum) that could be converted to cash. My company has been laying off employees and I wouldn’t be surprised if I lost my job at the start of Q2 next year. My ultimate goal is to make sure I do not have any forced liquidations of my equities.
What I am going to do is continue to hold cash and wait for my fat pitch. What is that fat pitch? Every morning I check the High Yield Index Option-Adjusted Spread and if it gets near 10 then I think is a good time to swing.
Portfolio Activity
I sold out of Schwab and Brighthouse Financial and used some of the proceeds to buy thepreviously mentionedDavis Select Financial ETF and I initiated a small position in Julius Baer Group. I cut my Altria position in half and used the proceeds to buy British American Tobacco. With an estimated 2023 dividend of $2.97, British American Tobacco yields 7.5%, even though they company only pays out 65% of its earnings. The company has a higher exposure to the smoking market’s discount and deep discount sector. When consumers begin to downtrade from Marlboros to cheaper brands, they should capture some of them through its cheaper brands. The company should also benefit from its Next Generation Products (NGPs) typically being priced at a discount to cigarettes. Lastly, their ongoing stock buybacks should be a ballast to the stock price.
I also bought a collection of thrift banks (FFBW Inc, Cullman Bancorp, Inc.
TC Bancshares Inc, Northeast Community Bancorp, Inc., William Penn Bancorp, PB Bankshares Inc, Texas Community Bancshares Inc, Bogota Financial Corp, First Seacoast Bancorp Inc, CFSB Bancorp Inc, Columbia Financial Inc and Bankwell Financial Group Inc.). The position size for each bank is small but in the aggregate it’s a 2% position on a cost basis. They’re all trading below tangible book value or they’re very cheap…and most of them are buying back or will hopefully begin to buy back stock.
The table below is a breakdown of my portfolio at the end of Q3. What you see below where my entire net worth, excluding my home, is allocated. Lastly, my 401k is 100% invested in a Small Cap Value Fund.
| Company | % |
| BRK.B | 13.7% |
| CSV | 8.9% |
| MU | 7.7% |
| MKL | 4.3% |
| AIMFF | 3.7% |
| MMP | 3.7% |
| BAC | 3.6% |
| EPD | 2.8% |
| DFNL | 2.2% |
| MO | 1.7% |
| EQC | 1.7% |
| GVAL | 1.5% |
| BTI | 1.5% |
| C | 0.9% |
| JBAXY | 0.9% |
| PLXP | 0.8% |
| HII | 0.7% |
| PREKF | 0.7% |
| INTC | 0.7% |
| DFIC | 0.6% |
| DISV | 0.5% |
| DFIV | 0.5% |
| AVIV | 0.5% |
| LMT | 0.4% |
| FFBW | 0.4% |
| TCBC | 0.2% |
| NECB | 0.2% |
| CULL | 0.2% |
| PBBK | 0.1% |
| TCBS | 0.1% |
| BSBK | 0.1% |
| FSEA | 0.1% |
| CFSB | 0.1% |
| AVDV | 0.0% |
| AVDE | 0.0% |
| AVES | 0.0% |
| AVSC | 0.0% |
| BWFG | 0.0% |
| EWUS | 0.0% |
| DFSV | 0.0% |
| CLBK | 0.0% |
| LAND | 0.0% |
| FPI | 0.0% |
| WMPN | 0.2% |
| 0.0% | |
| Gold | 3.0% |
| Platinum | 0.7% |
| Farmland | 4.4% |
| I Bonds | 8.4% |
| Cash | 10.3% |
| 401k | 7.3% |
Below is a breakdown by category:
| Category | % |
| Bonds | 8.36% |
| Cash | 10.26% |
| Conglomerate | 13.67% |
| Defense | 1.14% |
| Financials | 9.24% |
| Funeral | 8.90% |
| Insurance | 4.30% |
| International | 3.68% |
| Manager | 3.74% |
| Oil/Gas | 7.22% |
| Other | 3.19% |
| Pharma | 0.79% |
| Precious Metals | 3.77% |
| Real Estate | 6.10% |
| Semiconductor | 8.30% |
| Small Cap Value | 7.32% |


