
If you like what you’re reading then you will like my 2015 Fantasy Baseball Guide! Last year’s fantasy guide was more than 150,000 words and had 440 player profiles (of hitters and pitchers). My approach to player evaluation is to ask questions about what the player has done in the past and what he may do in the future. I certainly provide a narrative on how I feel a player will perform, but I also ask a lot of open ended questions that I hope will get you thinking about the information I’ve provided.
Before evaluating Justin Verlander’s 2014 season it’s important to remember he had core-muscle repair surgery after the 2013 season began. Therefore, it’s possible he was never 100% last year. This offseason he gets to train and condition himself without any restrictions.
There’s been a lot of hubbub about Verlander’s diminished velocity, but the numbers don’t bear that out. The image below shows his slugging and wOBA against the fastball since 2008.
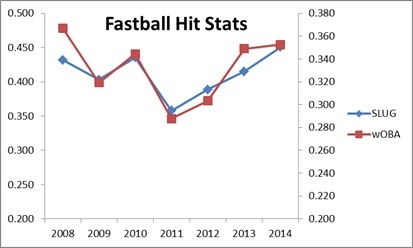 The first thing you’ll notice is he’s on a bad trend since 2011, but batters were squaring him up at the same rate from 2008 and 2010 and his numbers weren’t as bad as 2014s. Okay, maybe 2008s were, but the average of those seasons were much better than 2014s numbers.
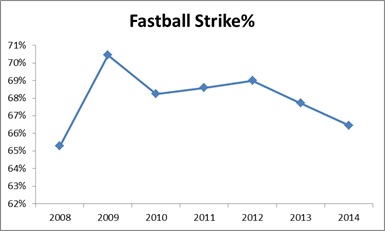
One of the big problems I saw with Verlander was fastball command. The image below shows the percentage of fastballs that were thrown for strikes since 2008. The first thing I noticed was he’s been throwing far less strikes with the fastball and in fact it was nearly at the same level as his 2008 season, which he coincidently had a 4.84 ERA and 1.40 WHIP (those numbers do not look all that different than his 2014 numbers).
 Another troubling trend is the overall performance of his secondary pitches (table below). The poor performance could be due to the lack of fastball command, but he lacked command in 2008 and his secondary offerings still missed a lot of bats.
| Splits | SLUG | BABIP | K% | BB% | WHIFF% |
| 2008 | .297 | .293 | 33.2% | 2.7% | 30.4% |
| 2009 | .314 | .310 | 37.4% | 2.0% | 31.7% |
| 2010 | .207 | .241 | 35.1% | 3.2% | 31.1% |
| 2011 | .269 | .247 | 35.7% | 2.0% | 32.7% |
| 2012 | .283 | .277 | 29.2% | 4.3% | 31.5% |
| 2013 | .342 | .314 | 27.8% | 4.0% | 27.5% |
| 2014 | .409 | .318 | 19.5% | 5.1% | 22.7% |
Bad fastball command can put hitters in good hitters counts which means they can sit on the fastball and not chance the curveball down in the dirt. Doug Thorburn wrote that Verlander’s biggest problem has been finding mechanical consistency with his delivery. The numbers don’t look promising, but he’s still in a small class of pitchers who could literally finish the year as the number one rated fantasy pitcher.
My 2015 projection for Verlander is 200 IP, 3.74 ERA, 1.32 WHIP, 175 strikeouts and 14 wins.


