2023 $250 12-Team Mixed NFBC Draft Recap: March 23, 2024

League Background

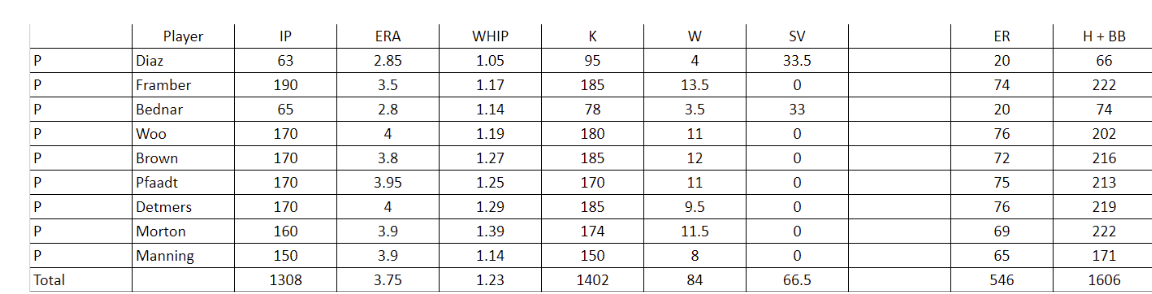
This is a 12-team mixed NFBC draft. The roster consists of 14 hitters, nine pitchers and seven bench players. You set your pitchers once a week; hitters are set twice a week; waivers occur once a week.

Overall Thoughts

This was my second draft this season and coincidently I had the same draft slot as my first draft a week ago. In the first draft I drafted my third highest player: Corbin Carroll. I debated for a few days whether or not I wanted to draft Carroll again. I ultimately decided not to for three reasons. 

First, there is a very minimal difference in value between Carroll and Julio Rodriguez. Second, if I drafted Rodriguez it would result in me taking different players to compliment Rodriguez. In other words I wanted to hedge my exposure to players and injury risk. Third, in my last league, before the draft, I learned I was going to have the second overall pick which means I’ll get to draft Bobby Witt. If I drafted Rodriguez that means I will have exposure to my #2-4 players.

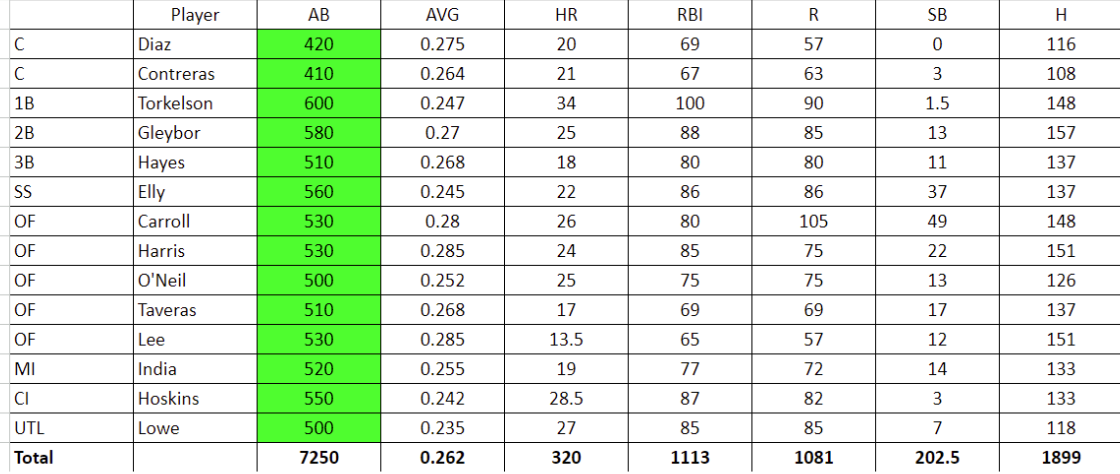
I’m much happier about this draft than my first draft. My benchmarks for hitting was a .263 batting average with 324 home runs and 198 stolen bases. The biggest change was I was able to get more clarity on injuries, rotation/lineup spots and better strategy (hopefully) that will do better in the early season.

My Team

Below is my team with my projections; not listed are my bench players but they will be discussed below the images:

Individual Player Analysis

Julio Rodriguez (#3) – Rodriguez followed up a great rookie season with more improvement in his sophomore year where he provided above average results in every category. The biggest downside for him is maybe the steals tick down to only 30. I think if he plays 150 games I think 30/30 is almost a lock. Most importantly, his supporting cast is better than last year which means his account statistics may improve too.

Rafael Devers (#22) – Devers was my 16th rated hitter. I’m projecting a .280 average with 33 home runs with plenty of accounting statistics. The biggest potential roadblock for 2024 is his supporting cast isn’t as good as last year.

Francisco Lindor (#27) – I was super excited to draft Lindor. With my second round pick I debated between Lindor and Devers because they’re ranked right next to one another. I projected 28 home runs which could be a little optimistic but if he plays a full season the floor is a 20/20 season.

Framber Valdez (#51) – I wrote about Valdez after my first draft. 

Camilo Doval (#51) – Edwin Diaz was gone when I made my pick but Josh Hader was still available but I still went with Doval because I think his job is as safe as Hader’s but Hader only averages about 55 innings now and Hader’s stuff is on the decline. Doval doesn’t have as good of stuff as Hader but Doval pitches in a better ballpark, will throw 10-20 more innings and doesn’t have anyone superior to him waiting in the wings.

Andres Gimenez (#70) – Right before my pick Nico Hoerner was drafted which increased my appetite for taking Gimenez here. Cleveland’s lineup is so bad I think Gimenez keeps the second batting order slot. Some projection systems have him hitting 18-19 home runs but I only projected 15. What I noticed in my prep there aren’t that many stolen base players that give you power and batting average and after Hoerner was drafted I wanted to lock up Gimenez. 

Andres Munoz (#75) – David Bednar was selected right before my selection but I had Munoz rated right after Bednar. Even if Bednar was available I was going to select Munoz because according to Stuff+, Pitching+ and Location+ both players are rated basically the same. I also think the Mariners probably win a few more games than the Pirates and I wanted to hedge against risk.

Christian Walker (#94) – I was surprised he was still available because his ADP is in the early 80’s. The biggest worry is his age; he turns 33 in a few days, which is when bat speed starts to decline and maybe he only steals 3-4 bases instead of the nine I projected.

Cedric Mullins (#99) – I think he got unlucky with the batting average last year. Yes, he struck out more overall but a lot of the uptick occurred in the second half of the season, which could have been due to two groin injuries. He had a .835 OPS before the injuries and .614 afterwards. I think his strikeout rate is only 20% this year and if he’s healthy all year, 20/20 is very reasonable.

Cal Raleigh (#118) and Wilson Contreras (#123) – I drafted Raleigh for the power and I had a plan to draft high batting player(s) to counterbalance Raleigh’s low batting average. I think Contrareas is underrated. He should get regular playing time and he’ll hit in the top two-thirds of the lineup.  

Shota Imanaga (#142) – Based on my learning from my first draft I made an effort to get starting pitchers with lower WHIPs. I relied on other projection systems to come up with my projection.

Bryan Woo (#147) – I wrote about Woo after my first draft.  

Masataka Yoshida (#166) – I’m projecting a .290 batting average with 16 home runs. He should hit fifth or sixth which means the accounting statistics should be good too. I personally don’t understand why he’s not leading off.

Yandy Diaz (#171) – I was really surprised Diaz was still available as his ADP is in the 130’s. Similar to Yoshida I’m projecting a .290 batting average with a little more power. 

Tyler O’Neil (#190) – I wrote about O’Neil after my first draft.  

Jonathan India (#195) – I wrote about India after my first draft.  

Daulton Varsho (#214) – I think Varsho is a great value for my team because I drafted two batting average anchors prior to this pick. Maybe he only hits .235 but it should come with 25/15 with a lot of accounting statistics. Varsho is a very good defender so he should play every day and should bat fifth against righties because the Blue Jays are very right handed heavy.

Brandon Pfaadt (#219) – I wrote about Pfaadt after my first draft.  

Nick Lodolo (#238) – this is a bet on his raw stuff and hopefully he can stay healthy.

Leody Taveras (#243) – I wrote about Taveras after my first draft.  

Brandon Lowe (#262) – I wrote about Lowe after my first draft.  

Dean Kremer (#267), Trevor Rogers (#286) and Tanner Houck (#334) – I drafted them because they have great matchups in the second week of the season. I expect to release them after week two.

Jeff McNeil (#291) – He was drafted because I wanted someone with a good batting average and a lot of playing time on my bench.

Trevor Megill (#310), AJ Minter (#315) and Jason Adam (#358) – They were drafted for the first half week of the season. Maybe Megill gets a save the first weekend? Anyway, these guys are next in line for saves and should hopefully do well the first half week. All these players could be dropped after week two.

Jameson Taillon (#339) – I thought he could be healthy to begin the season but he won’t be so he will be dropped and most likely picked up off waivers when he is healthy.
Posted in Fantasy Baseball | Leave a comment

2023 $150 12-Team Mixed NFBC Draft Recap: March 17, 2024

League Background

This is a 12-team mixed NFBC draft. The roster consists of 14 hitters, nine pitchers and seven bench players. You set your pitchers once a week; hitters are set twice a week; waivers occur once a week.

Overall Thoughts

This is the first of three drafts. I had the third overall pick which was great because I was guaranteed to get Corbin Caroll or Bobby Witt. I wish I could take some individual picks back but overall I am satisfied with my team. My benchmarks for hitting was a .263 batting average with 324 home runs and 198 stolen bases. My pitching has a high WHIP but hopefully I can stream my pitchers to mitigate it.

With my draft prep I noticed stolen bases were more difficult to find at the end of drafts which is why I prioritized getting stolen bases with my early picks.

My Team

Below is my team with my projections; not listed are my bench players but they will be discussed below the images:

Individual Player Analysis

Corbin Carroll (#3) – I’ve been a believer in Carroll for almost two years now. Last year I drafted Carroll last year in the fifth round. Like I mentioned earlier it was a toss up between Witt and Carroll. Julio Rodriguez was close but I wanted someone who could go 20/50 compared to 30/30. The biggest worry about Carroll is health; specifically, his shoulder. It seems like he could get hurt at any point because of how much torque he puts into his swing.

Elly De La Cruz (#22) – I normally take boring, low variance players in the 2nd and 3rd round but I couldn’t help but take a shot on another 20/50 upside player. Most fantasy experts believe his projections (.245 with 22 home runs and 35 stolen bases) is a hedge in that he either exceeds his projections or dramatically underperforms. I agree with the thesis. What put me over the edge on drafting him was the injury to TJ Friedl. If Elly has a slow start he’s not getting sent to the minors; the Reds will allow him to figure it out. Before the Friedl injury and Noelvi Marte suspension it was conceivable the Res would send Elly to the minors if he started slow but not anymore. Elly is vastly superior to any replacement the Reds have.

Michael Harris (#27) – It was between Harris and Luis Robert. I went with Harris because I wanted a safer batting average anchor to counterbalance the Elly pick. His career statistics indicate he’s pretty safe for batting average but there are flaws with approach. Last year he did a lot of damage by swinging early in counts. However, he’s hitting more fly balls and for harder contact…and to top it off he’s still only 23 years old.

Edwin Diaz (#46) – Diaz is the best closer in baseball…or at least on my board. His year-by-year output is high variance but when he’s at his best, he’s better than everyone. I debated getting a starting pitcher in the 3rd round but the best value was Diaz. The next best pitcher was Framber Valdez, which I got with my next pick. I drafted Diaz ahead of Valdez because Valdez’s ADP was much higher than Diaz’s and the two owners behind me already had starting pitchers which lowered the probability they would draft Valdez.

Framber Valdez (#51) – Valdez was the ninth best pitcher on my board. I knew if I was going to draft Diaz in the 4th I wanted an innings eater who could give me wins. In the past two years I’ve noticed my pitching staffs were consistently lacking in wins. I think that is due to me liking good pitchers on bad teams, which is probably why they’re value picks in drafts. The Astros probably have the best one or two bullpens in the Majors so if Valdez makes 31 starts I’m hoping for 14-15 wins.

Gleybor Torres (#70) – I have no idea why Torres is going so late in drafts. He provides statistics in every category, is 27 years old and is in the last year before hitting free agency. Is it possible he goes 30/20? It’s very possible. If he plays 140 games, 25/15 seems like his floor.

David Bednar (#75) – Bednar hasn’t pitched in Spring Training but it seems like he’s on pace to be ready for Opening Day. He’s my fifth closer. I’m not worried about him getting traded and becoming a set-up guy. If he gets traded I think he’ll still be the closer. I also think the Pirates could win 82-86 games this year.

Yainer Diaz (#94) and Wilson Contreras (#99) – I think both players hit 20 home runs, play every day, bat in prime spots in the lineup and will have batting averages that won’t hurt me. Last year Contreras had 30 games at DH. Does that repeat this year? Probably not, but I think his contract and bat means the Cardinals will give him 120 games behind the plate. 

Spencer Torkelson (#118) – In the last few seasons I’ve gotten burned by trying to find power in the value bucket. According to StatCast, Torkelson was 17th overall in HardHit%. I had another player pegged at this spot but A) my team was lacking power and B) there weren’t that many legit 40-home run potential corner infielders left. The additions of Parker Meadows and Colt Keith along with a healthy sophomore season from Riley Greene I think it’s possible Torkelson goes 100/100.

Ke’Bryan Hayes (#123) – At this point in the draft I didn’t have a third baseman and I wanted to lock up the position. I’ve owned Hayes the past two seasons because I’ve always been tempted about his potential to hit more home runs due to his high hard hit rate. Last year the hard hit rate and fly ball percentage all increased but his HR/FB rate was only 9.8%. I think he got unlucky with the home runs last year and I think if he just repeats last year he will have 18 home runs.

Bryan Woo (#142) – Woo threw 130 innings last year which means I think he could throw 160-170 innings. I love his home ballpark and division. He’s in the low 100’s on Stuff+, Location+ and Pitching+. 

Hunter Brown (#147) – I actually liked Brown more than Woo but Woo had a lower ADP. As I mentioned about Framber Valdez, I’m hoping for above average wins. Like Woo, Brown is in the low 100’s on Stuff+, Location+ and Pitching+. I think Brown got very unlucky last year. I can see a season with a 3.50 ERA with more than a strikeout per inning.

Rhys Hoskins (#166) – I’m hoping for 30 home runs with a .245 batting average. The Brewers are lacking offense; combine that with his contract I think Hoksins plays every day in the cleanup spot.

Jonathan India (#171) – Like I mentioned about Elly De La Cruz, with all the injuries India is going to play every day. With the injury to Matt McLain it looks as though India will leadoff all the time and if not he almost certainly will leadoff against left handed pitching.

Brandon Pfaadt (#190) – I really liked what I saw at the end of the season and playoffs. 

Tyler O’Neil (#195) – I was a big believer in O’Neil last year. I love the raw skills and he’s finally out of St. Louis. I love his home ballpark and he’s in his walk year. Three years ago, in his only fully healthy year, he hit 34 home runs with 15 stolen bases. 

Leody Taveras (#214) – He’s in a good lineup and his defense will allow him to play every day…which if happens he’s a 15/15 player.

Reid Detmers (#219) – Detmers is very close to 100’s for all three: Stuff+, Location+ and Pitching+. I like the home ballpark and the ballparks in his division. Strikeout rate jumped up last year where he struck out more than a batter per inning.

Jung Hoo Lee (#238) – I wanted Steven Kwan at this spot but I settled for Lee because I wanted his batting average. I don’t have an opinion about his output but the projections think he will hit .285-plus. 

Ceddanne Rafaela (#262) – He’s the best defender in center for Boston and I think he’s the everyday center fielder. If he plays 140 games I think he could steal 30 bases. He’s also a hedge if O’Neil gets hurt.

Charlie Morton (#267) – Morton will be a streamer for me. I think he can still get a lot of strikeouts. The biggest issue is what will his WHIP be?

Jeff McNeil (#286) – I drafted him as Lee insurance. I projected both players to hit .285 with 12/12.

Ranger Suarez (#291) – I don’t like his stuff and I think there’s a slight regression in the strikeout rate. He’s a streamer for me.

Matt Manning (#310) – His velocity is up this spring and he is striking out 33% hitters. If throws 150 innings with a 22% strikeout rate, Manning is a borderline top 50 starting pitcher. 

Vaugh Grissom (#315) – I wanted a backup shortstop and he was the best left.

Jameson Taillon (#334) – I think he was extremely unlucky last year. Two years ago he had a 3.91 ERA and 1.13 WHIP. The Cubs gave him $68 million over four years. I don’t think he’s nearly as bad as his 2023 numbers. 

Giovanny Gallegos (#339) – He’s Ryan Helsley insurance.  

Tyler Black (#358) – I’m hoping the Brewers let him play second base. They desperately need offense and Black provides that offense. Black is probably getting dropped on my first waiver week.

Posted in Fantasy Baseball | Leave a comment

2023 Wrap Up

Disclaimer

Nothing discussed/written should be considered as investment advice. Please do your own research or speak to a financial advisor before putting a dime of your money into these crazy markets. In other words, if you buy something I bought, you deserve to lose your money.

The only reason why I am making my portfolio public because it provides accountability to me. Some or all the analysis I provide could be from the top of my head and should not be considered accurate.

My investing goal is simple; to try to manage risk while being fully invested without market timing. Howard Marks said it best, “even though we can’t predict, we can prepare.”

All my references to the Market are only for the US Market.

Performance

For 2023 my portfolio returned 22.96% compared to 26% for the S&P 500 (with dividends reinvested).

The table below is a breakdown of my portfolio at the end of 2023. What you see below where my entire net worth, excluding my home, is allocated. Lastly, my 401k is 100% invested in a Small Cap Value Fund.

Company%
BRK.B14.4%
CSV5.5%
MKL4.5%
SYLD2.9%
MU2.8%
GVAL2.8%
EPD2.5%
AVES2.3%
DFEV2.3%
AVDV2.1%
C2.0%
IVAL1.9%
AVIV1.7%
DISV1.6%
AVUV1.6%
BTI1.5%
DFIV1.5%
DFSV1.4%
DFIC1.4%
AVDE1.2%
RSBT1.1%
FYLD1.1%
EQC1.0%
PREKF0.8%
FRFHF0.8%
DEEP0.6%
FPI0.6%
FRDM0.6%
FFBW0.3%
NECB0.2%
WMPN0.1%
TCBC0.1%
CULL0.1%
PBBK0.1%
TCBS0.1%
BSBK0.1%
CFSB0.1%
FSEA0.1%
AVSC0.0%
EWUS0.0%
BWFG0.0%
CLBK0.0%
LAND0.0%
T Bills9.0%
Gold2.5%
Platinum0.7%
Farmland4.0%
I Bonds4.6%
Cash1.8%
401k11.7%

Below is a category breakdown:

Bonds4.62%
Cash1.82%
Conglomerate14.42%
Financials3.35%
Funeral5.54%
Insurance5.22%
International20.42%
Managed Futures1.14%
Mid Cap Value2.85%
Oil/Gas3.23%
Precious Metals3.12%
Real Estate5.51%
Semiconductor2.81%
Small Cap Value15.34%
T Bills9.04%
Tobacco1.54%

Q4 Commentary

When gold first roughly $2,100 I sold about 40% of my physical gold and bought shares of SYLD. With my dividend income I bought more EPD and BTI. I also sold out of my Aimia position because I didn’t like their governance. Specifically, choosing to give a $3.10 placement to insiders “after robust arms length negotiations”.

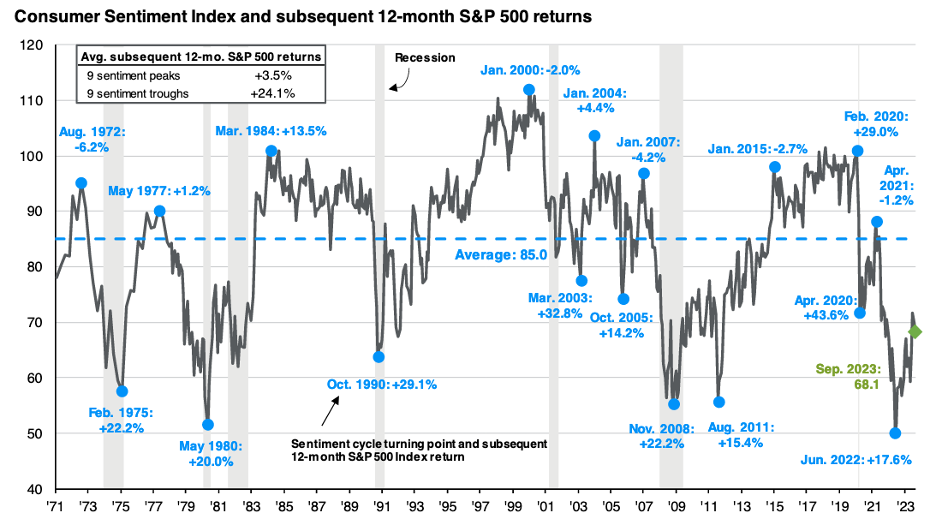
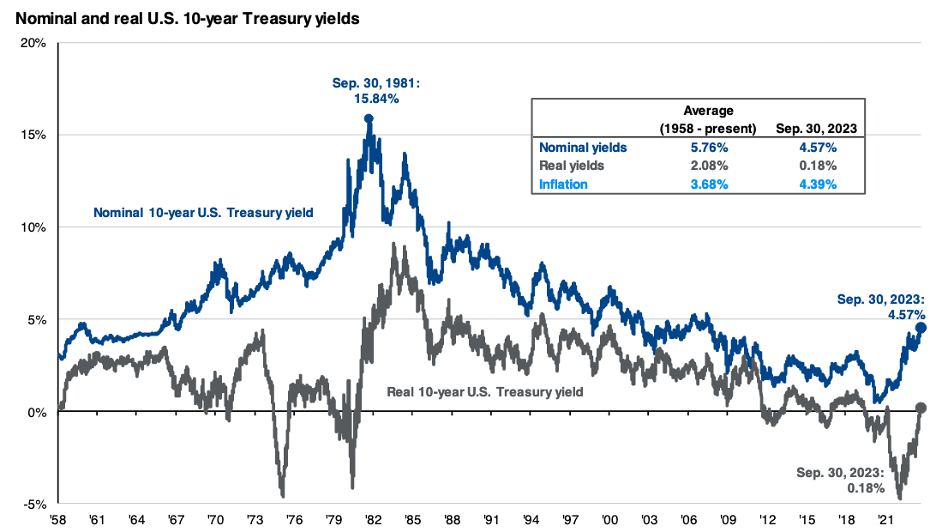
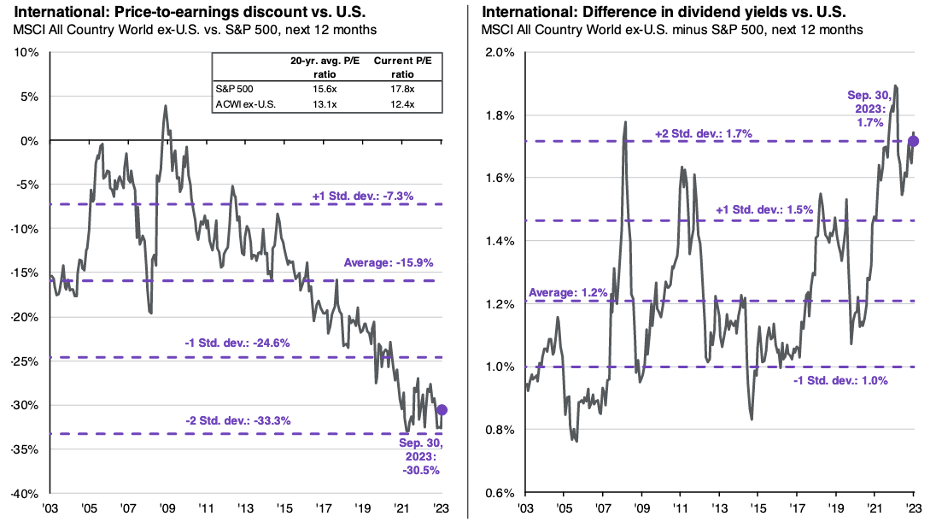
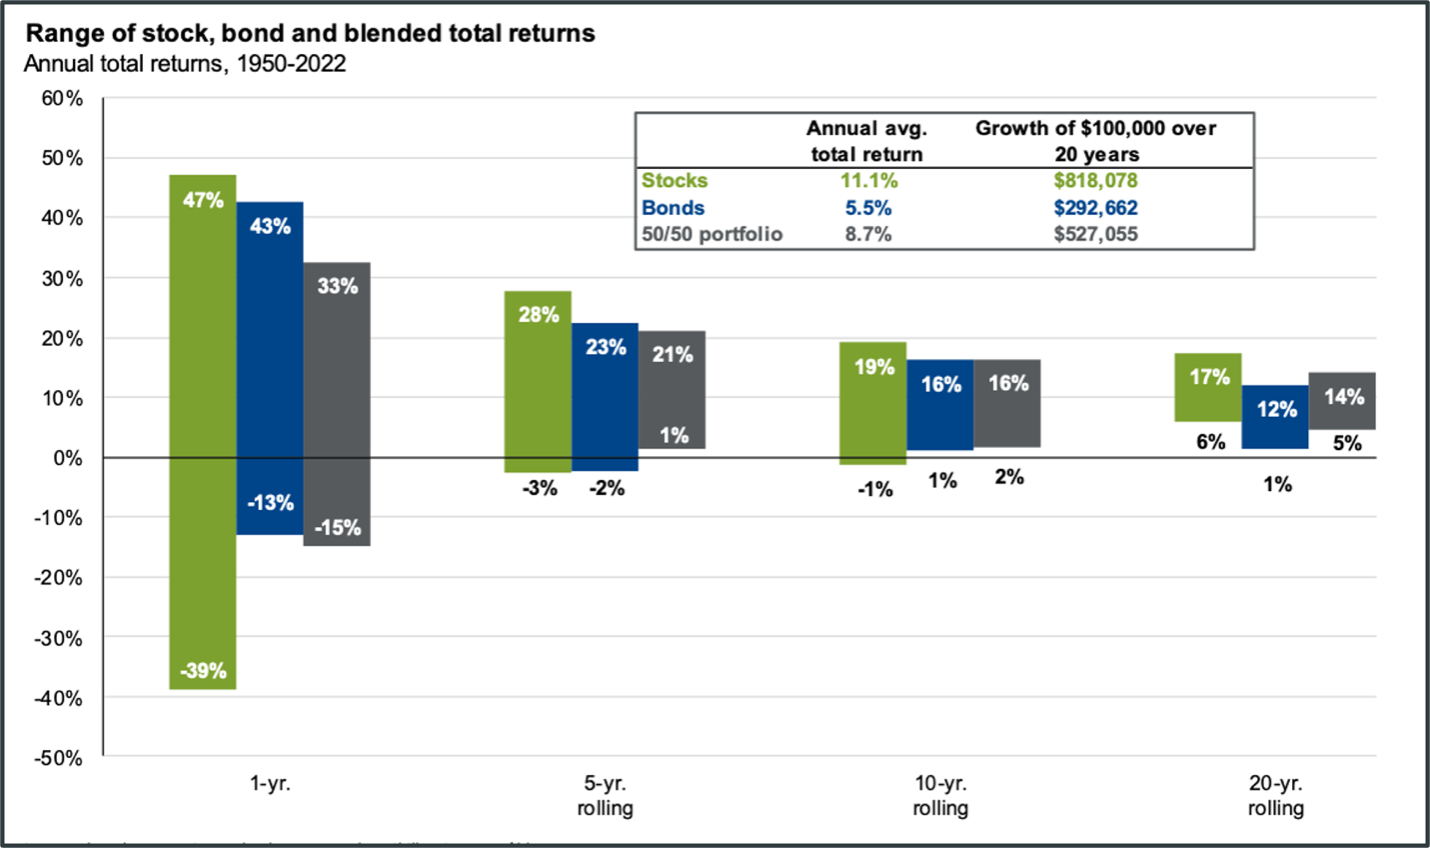
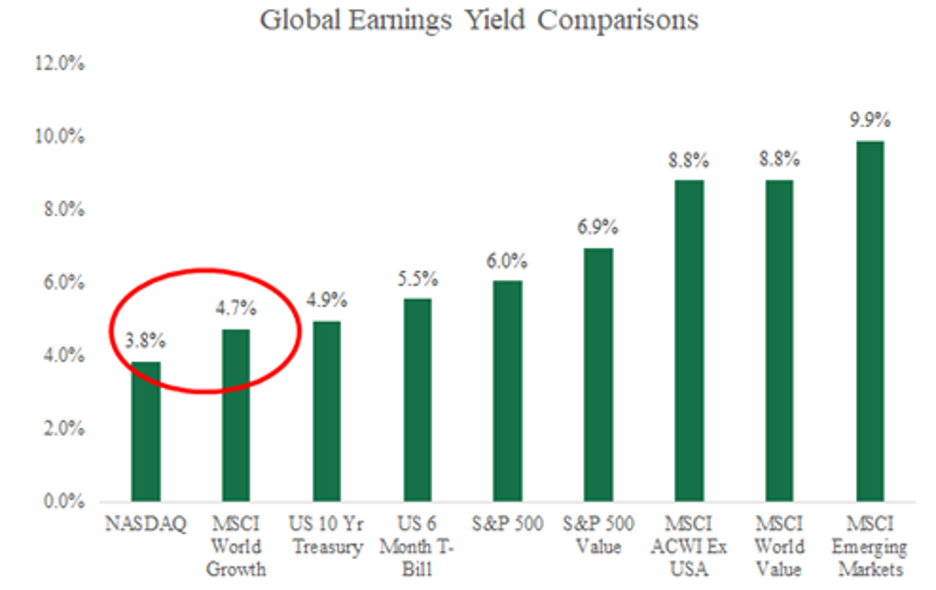
Below are charts and quotes I enjoyed during Q4 this year:

“Some argue that holding significant cash is gambling, that being less than fully invested is akin to market timing. But isn’t a yes or no decision the crucial one in investing? Where does it say that investing means always buying something, even the best of a bad lot? An investor who can’t or won’t say no forgoes perhaps the most valuable tool available to investors.” —Seth Klarman

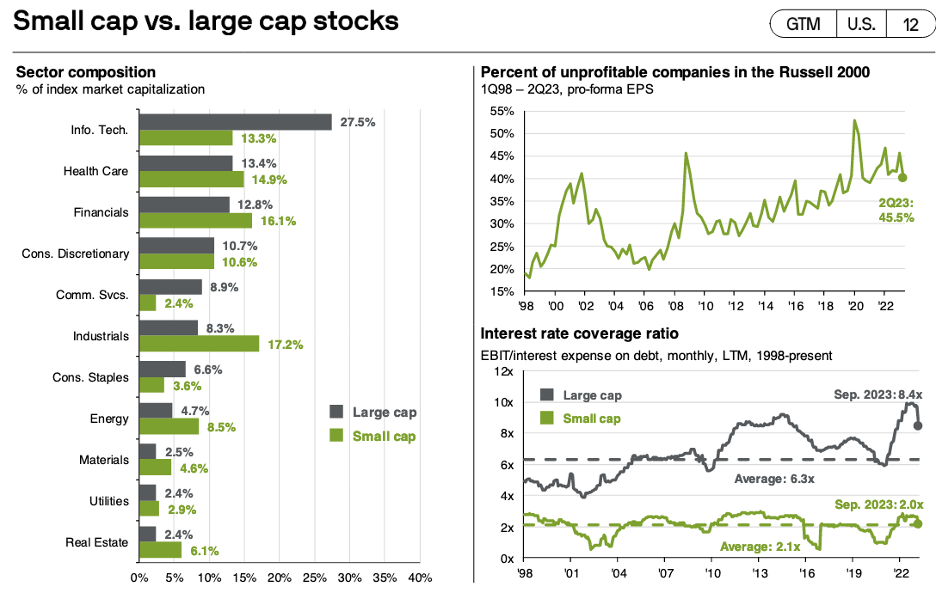
“The good news for small-cap investors, as Spencer Jakab points out, is that over the past 11 recessions, small-caps have beaten larger-caps by over 16% in the 12 months after the recession started and have done quite well in previous recoveries. For example, from 2001 through 2004 (the period following the dot-com bust), the S&P 500 lost about 2% but the Russell 2000 value gained 80%. The historical record supports small-cap value’s outperformance, with the annualized return of small-cap value more than 400 bps higher than that of larger-cap growth companies since 1926 (through July of 2023), according to data provided by Nobel Prize-winning economists Eugene Famma and Kenneth French.

However, investors in small-cap companies should be especially wary (and this is why good stocking picking in this area of the market is so important) of potential minefields: 45.5% of the companies in the Russell 2000 are unprofitable, and their EBIT (earnings before interest and taxes) covers a much smaller percentage of their interest expense than among their large-cap brethren. (For further details, see the accompanying chart.) ”

Source: https://boyarresearch.substack.com/p/boyar-researchs-q3-letter

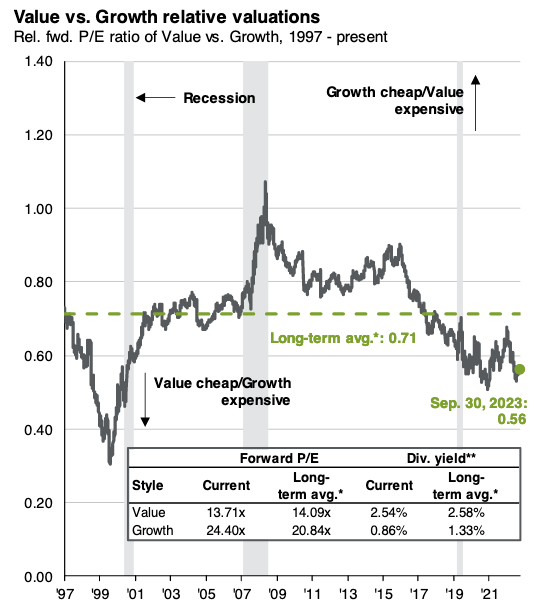
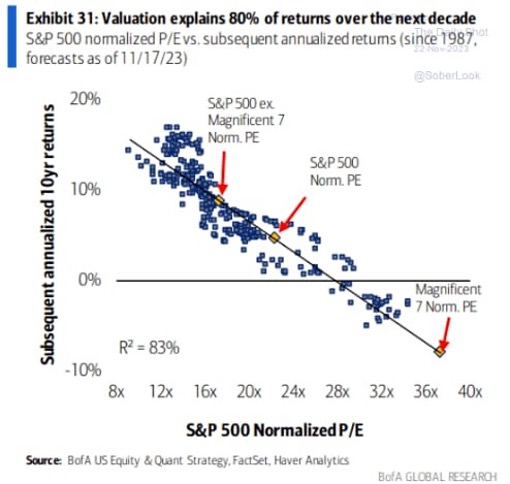
“This idea that, at the right price, growth can be a value is terribly confusing to those who treat growth as the opposite of value. The opposite of cheap isn’t growth; it’s expensive. So instead of looking at growth versus value, we look at low P/E versus high P/E. A convenient way is to rank order the S&P 500 by P/E ratio, comparing number 50 to number 450. Currently, the 50th lowest P/E stock sells just over 8 times earnings, and the 50th highest sells at 60. So, the highest priced stocks are about 7 times more expensive than the lowest priced. Over the 30-plus years we have data, the P/E ratio averages about 4, bouncing between 3 and 5. (So, if there are 50 stocks below 10 times earnings, there are 50 over 40.) It was meaningfully higher only one time—when it hit 9 times at the end of the internet and tech bubble in 2000.”

Source: Bill Nygren https://oakmark.com/news-insights/value-vs-growth-then-and-now-u-s-equity-market-commentary-3q23/

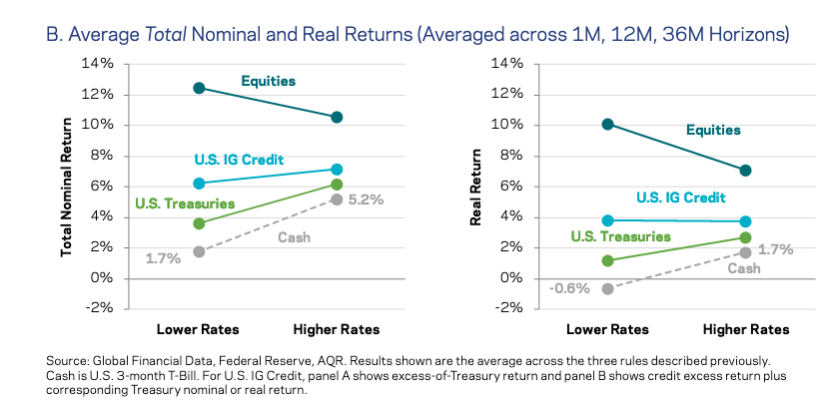
Source: https://www.aqr.com/Insights/Research/Alternative-Thinking/Honey-the-Fed-Shrunk-the-Equity-Premium

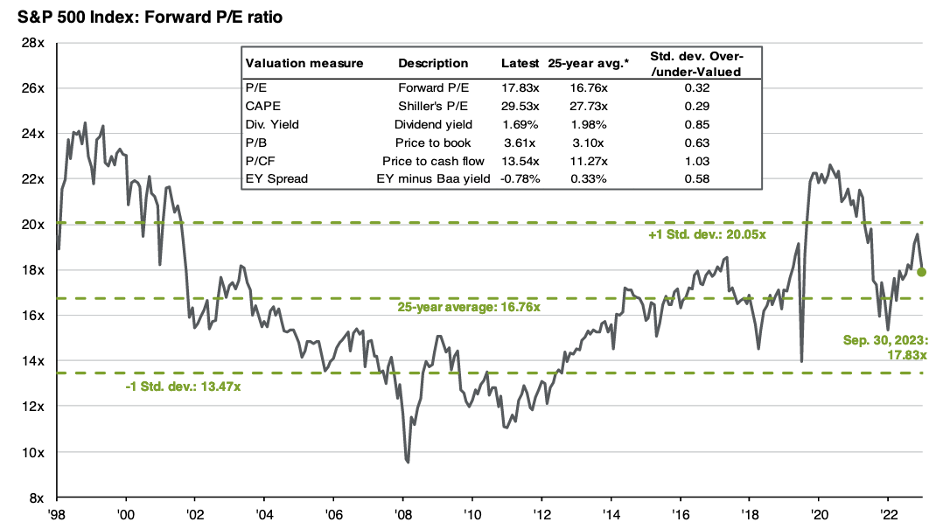
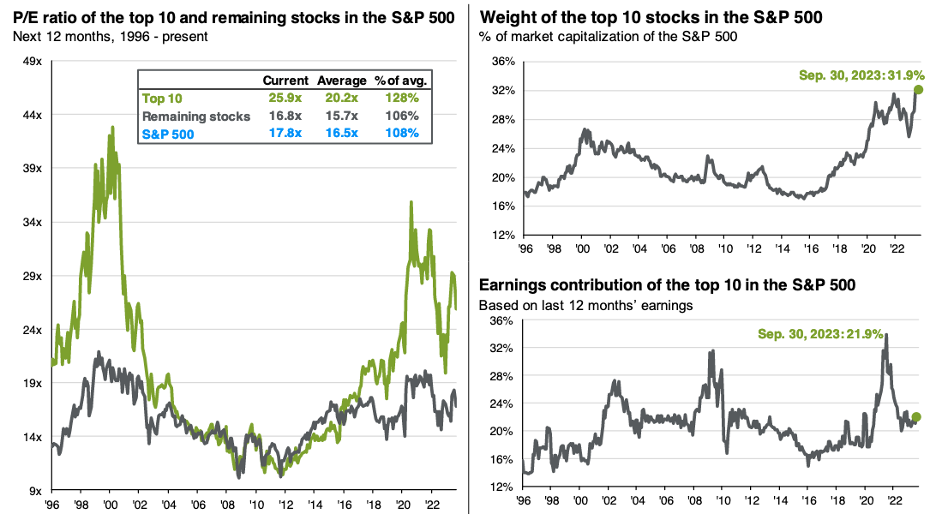
Source: https://am.jpmorgan.com/content/dam/jpm-am-aem/global/en/insights/market-insights/guide-to-the-markets/mi-guide-to-the-markets-us.pdf

Source: https://boyarresearch.substack.com/p/boyar-researchs-q3-letter

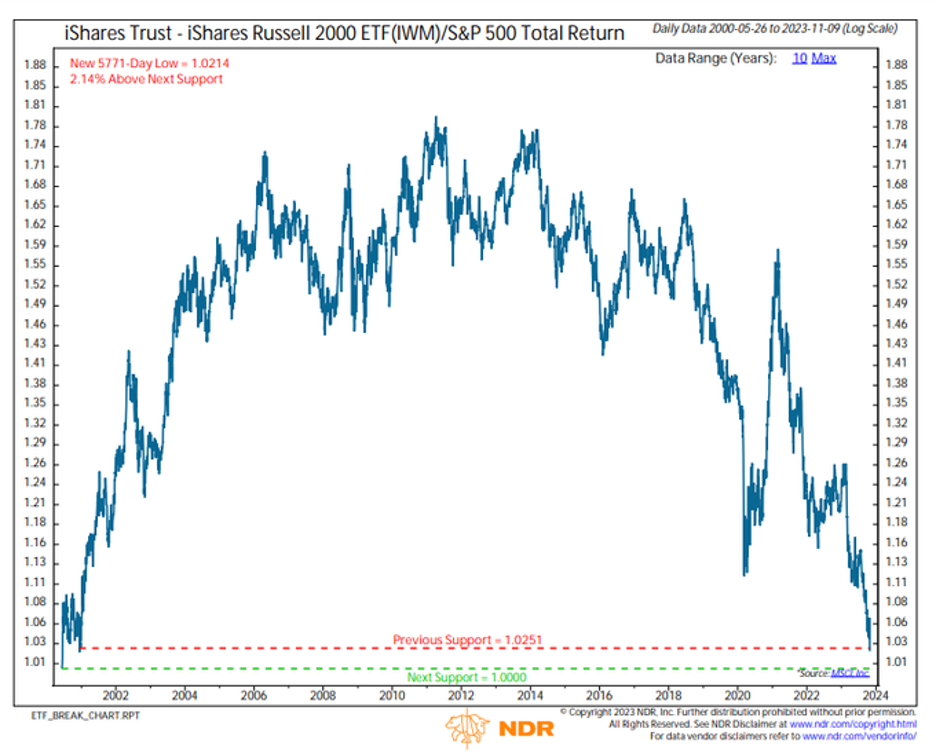
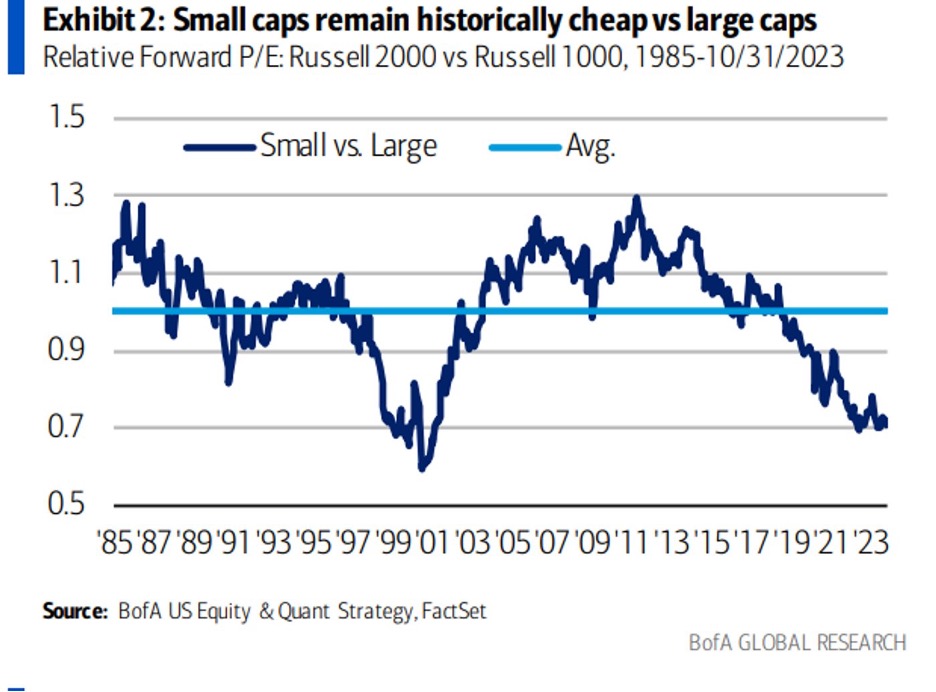
Small-caps are trading at their lowest level vs. the S&P 500 (total return) in almost 23 years.

Source: https://twitter.com/_rob_anderson/status/1723004783492042962

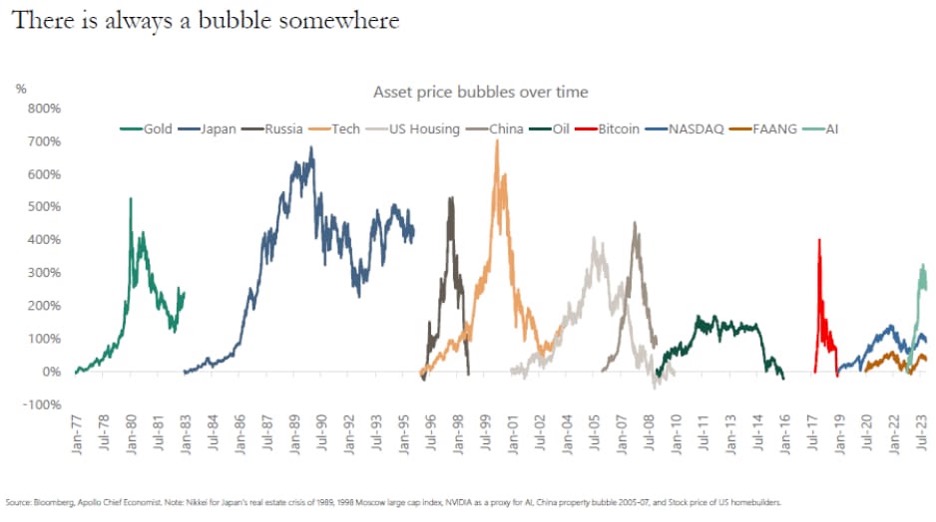
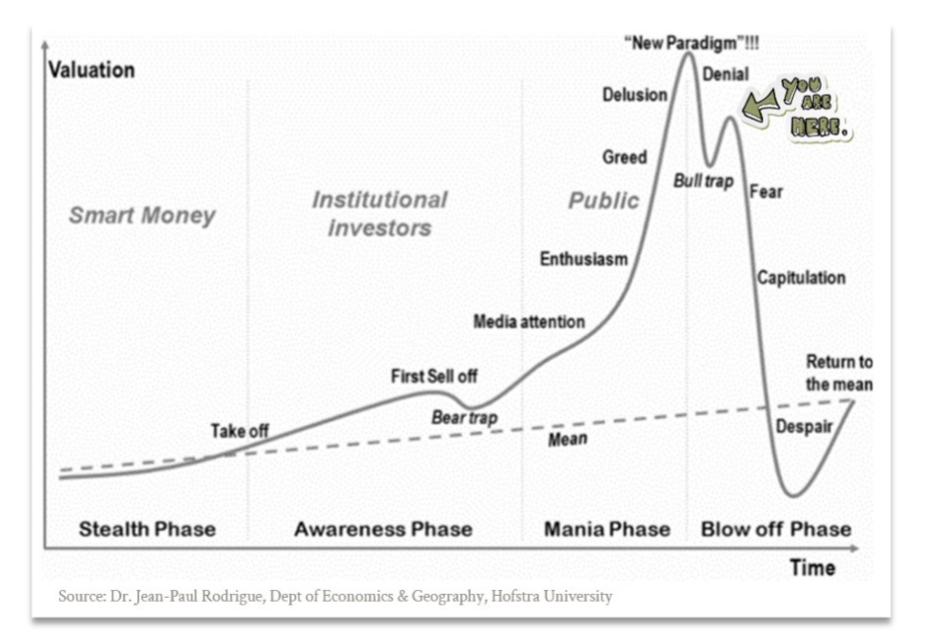
Apollo on asset price bubbles since 1970.

Small-caps are the cheapest size segment by market capitalization, trading at a 19% discount to historical averages

Midcap stocks are trading at a 4% discount.

Large-cap stocks are trading at a 12% premium to historical averages

Megacap stocks, represented by Russell Top 200 XX:RT200, are trading at a 18% premium.

Source: https://twitter.com/Greenbackd/status/1724456892477681879

Source: https://app.hubspot.com/documents/22324760/view/718167065?accessId=126fb9

Source: https://am.jpmorgan.com/content/dam/jpm-am-aem/global/en/insights/portfolio-insights/ltcma/noindex/ltcma-full-report.pdf

Source: https://www.ft.com/content/2e1a235a-8a46-47f3-b040-5ca21a04ebf4

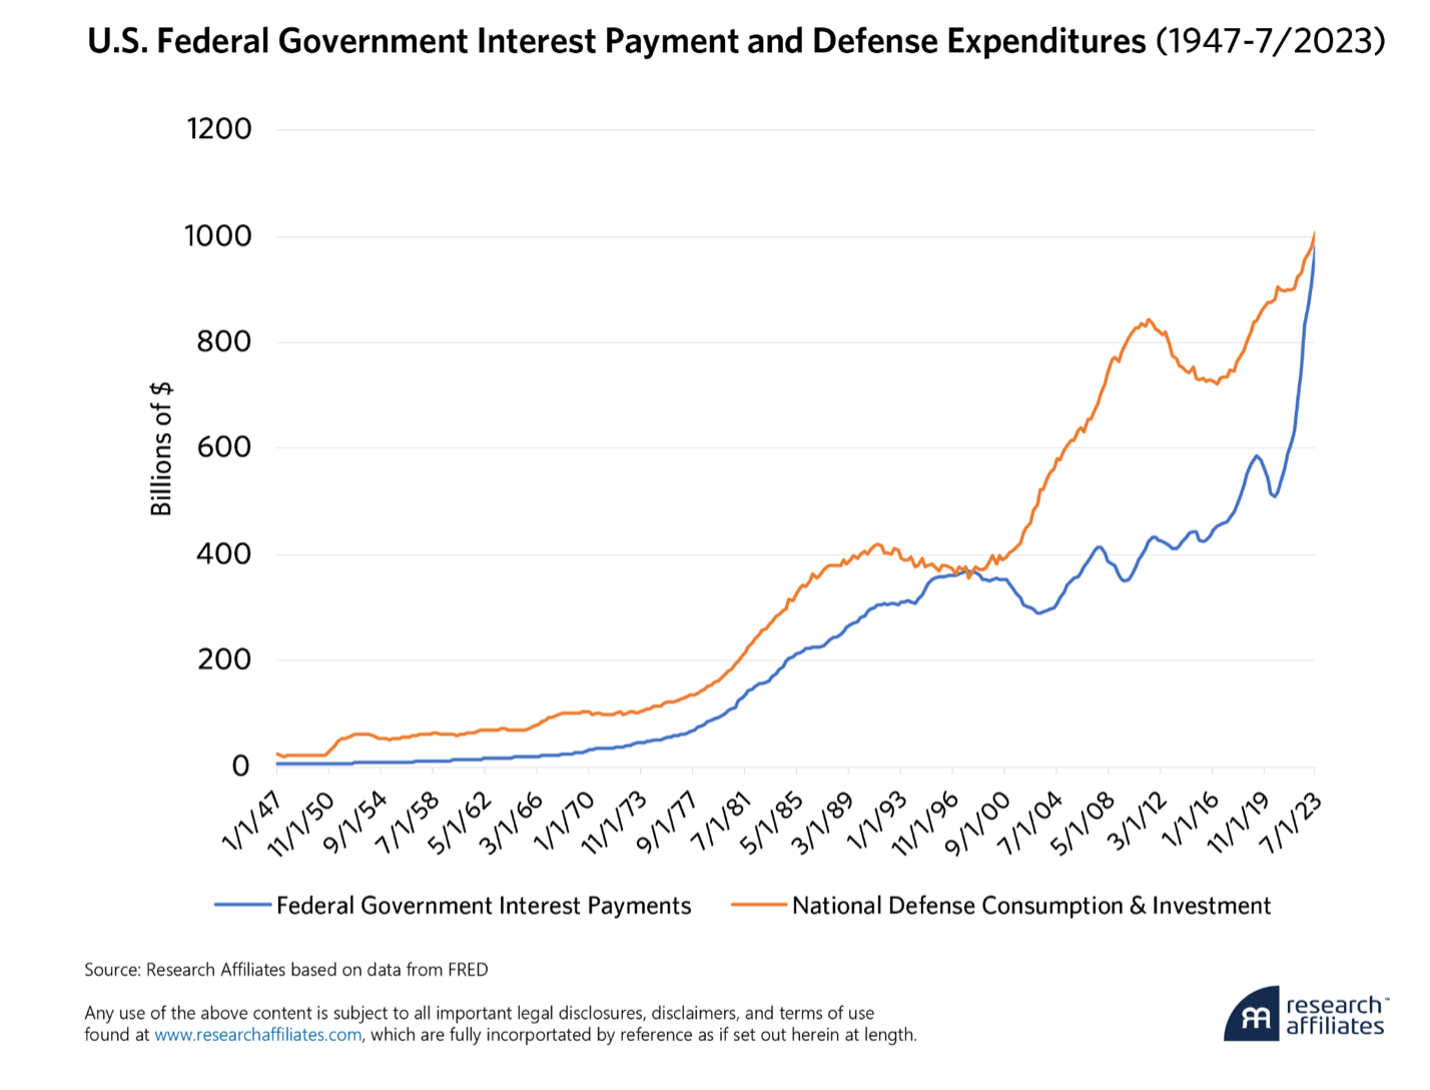
Source: https://www.researchaffiliates.com/content/dam/ra/publications/pdf/1005-from-abundance-to-austerity.pdf

Posted in Investing | Leave a comment