
How To Project Wins For Starting Pitchers?

Like everything I post this is going to be another stream of consciousness. In the last two seasons I’ve won three out of four NFBC leagues. What all those teams have in common is my hitting was exceptional and my pitching was mediocre.

After reading books by Robert B. Cialdini, Richard Thaler and of course Daniel Kahneman I know one of the hardest things for humans to do is challenge our deeply held beliefs especially when we’ve been successful.

d-kahneman-500px

I’ve been above average at finding pitching off waivers, but the  starting pitching I draft always struggles. In the past the most wins I would project is 16 with the majority of pitchers getting 12-14 wins. The reason why I didn’t have much of a difference (or spread) in wins is because wins are unpredictable. In the last two seasons Jacob deGrom has 21 wins while Marco Gonzales has 29. Assuming health, what are the odds Gonzales has more wins in 2020? With no offense to Gonzales, deGrom is a vastly superior pitcher so the smart money should be on deGrom.

The data I am going to site are pitchers who threw at least 150 innings per season during these seasons 2015-2019. I choose these years because this is the time frame when starters’ workloads have decreased substantially on a per start basis.

On average 77 pitchers will throw 150 innings. I currently have 134 pitchers projected to throw that many innings. That means only 57% of my projected pitchers will get to the innings threshold (wow!).

Of the 77 pitchers, roughly six will have 18 or more wins (table/image below).
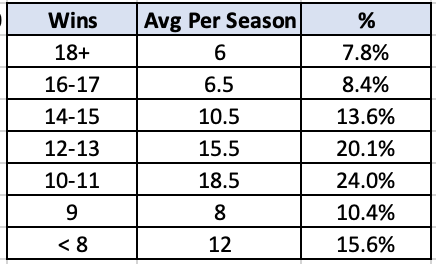
Screen Shot 2020-01-18 at 8.30.07 PMGiving someone a projection of 18 wins gives that pitcher a big advantage against a pitcher who may only be projected for 14. However, if Gerrit Cole makes 32 starts he probably has the highest probability of being of those six pitchers with 18 wins.

I think the six best teams are (in no particular order): Braves, Dodgers, Twins, Yankees, Athletics and Reds (Even before we learned the Astros were cheating dochebags, I thought they took a big hit with the loss of Cole, Will Harris, Wade Miley, Colin McHugh and Robinson Chirinos.)

I don’t want this to happen but suppose Freedie Freeman or Matt Chapman miss most of the 2020 season. Both of their teams heavily rely on them and if they miss time their teams will probably not earn as many wins; in fact it would be a 5-10 game swing. So maybe I project 15 wins for Mike Soroka while only 12 for Chris Paddack. I think Paddack is the better pitcher and will provide better rate stats, but Soroka probably will earn more wins because the Braves should be better than the Padres.

The image below shows the average xFIP and win totals. The data suggests that in general better pitchers earn more wins, but at the individual level wins are still random.
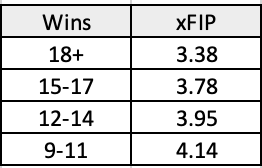
Screen Shot 2020-01-19 at 1.13.11 PMdeGrom is one of the four best pitchers in baseball. You could make the argument he’s the best entering 2020. Despite his talent, he still has to pitch for the Mets; behind that defense and with Wilson Ramos behind the plate. I find it difficult to project more than 14 wins. Odds are Cole, Max Scherzer and Justin Verlander have more wins. In the past I would have projected these four pitchers to have between 15-16 wins each because I didn’t want wins to severe alter my rankings. I now realize this was most likely not optimal.

Lets look at two more pitchers: Jose Berrios and Noah Syndergaard. If you remove wins Syndergaard is the better pitcher, but when wins are added Berrios becomes more valuable. My thesis is the Twins could be the best team in the AL, which means if Berrios makes 31 starts it would be difficult for him not to win 14 games. In the past I would predict 13-14 wins for Berrios on the basis that skill is more predictive of wins.

Screen Shot 2020-01-19 at 1.17.17 PM
Berrios is currently my 26th starting pitcher. Lowering his win projection from 15 to 14 drops him to 33rd. So, win totals have a pretty dramatic effect once you move past the top 7-8 pitchers (I feel like this is a duh moment). 

Again I go back to the question. Should fantasy draft pitchers with better skills or pitchers with somewhat less skills but has a better opportunity for wins?

The Rays won 96 games and only one pitcher had more than 10 wins. The Braves won 97 games and only one pitcher had more than 14 wins. The Dodgers won 106 and Kershaw had 16 wins, Ryu and Buehler won 14.

Wins are difficult to predict. Pitchers on good teams have a higher probability for wins, but it is not guaranteed. Therefore, I believe the best way to project wins is to stay within a range of 10-16 wins with most in the 12-15 range.
Posted in Fantasy Baseball | Leave a comment

The Fantasy Fallout of the Rays-Cardinals Deal

Yesterday the Cardinals traded outfielders Jose Martinez and Randy Arozarena to the Rays for two prospects: pitcher, Matt Liberatore and catcher, Edgardo Rodriguez. All of my analysis will focus on the fantasy values for 2020.

Martinez will be in the wrong side of a platoon at DH/1B. For his career he’s a .331/.405/.570 against lefties, which means he’ll have value during the times the Rays are facing lefties. To be fair, he’s hit against righties too but with Ji-Man Choi and Yoshi Tsutsugo in the picture it going to be difficult for Martinez to get at-bats.

According to Keith Law’s analysis, Arozarena is the most valuable player in the deal. I’ve never seen Arozarena play and before this trade I knew next to nothing about him so I’m not going to wax on about the skills he’ll provide. By reading to Mr. Law’s report Arozarena will probably play between right and center field, which leaves Hunter Renfroe as the fourth outfielder. Austin Meadows and Kevin Kiermaier will probably miss time throughout the year so Renfroe’s draft day value will be suppressed but he could be a lottery ticket at the end of drafts. Renfroe will be a great lottery ticket towards the end of NFBC drafts.

For fantasy, Arozarena probably won’t bring anything useful in shallow formats because he won’t hit for power or steal enough bases to matter. I can see a scenario where he’s a 15/20 player, but the probability of that happening is less than 20 percent. I think 10/15 with a .280ish batting average is most likely.

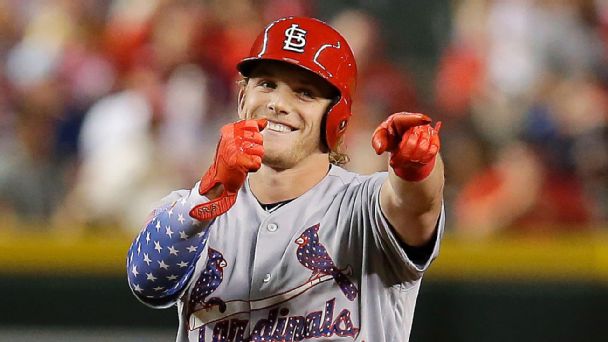
The most interesting part of the deal is what this means for the fantasy values of Cardinals’ players. Harrison Bader will (finally) play every day in center field. I was high on him entering 2019 and his batting average unfortunately got BABIPed and was sent to the minors and lost his job. I think he can hit .239 with room for more because of speed. Also, it’s possible he’s a 20/20 players. It will be difficult to get the steals because he’ll likely bath eighth, but the upside is there. Lastly, if he struggles offensively, his defense is so good he should continue to play every day.

bader

Tommy Edman will also get to play every day, probably in left field. He only played a little more than half a season, but he had the third highest WAR among position players. It seems like every year the Cardinals call-up a non-highly touted player and he does exceptionally well. Roster Resource has Dexter Fowler batting leadoff, but I think Edman will either bat first or second. (Quick aside, Fowler is done. He maybe a fifth outfielder in a 15-team mixed, but that’s his upside.) Like Bader, Edman could be a 20/20 player. I think the probability of this happening is more than 50 percent.

By June Tyler O’Neill could be the starting right fielder. He’s very much like Renfroe in that he will hit for a lot of power but will hit in the .230’s. Another scenario, albeit a more unlikely one, is Matt Carpenter gets benched, Edman moves to third base and O’Neill plays in left field. O’Neill is a great lottery ticket for the last three rounds of your NFBC draft.

Posted in Fantasy Baseball | Leave a comment

How I Evaluate Injury Prone Players & Rich Hill

A question I have continually grappled with is how to rank and project players who will most likely miss 25 percent or more of the season. The poster child for this type of player the past three years has been Rich Hill.

rich-hill

For the 2017 and 2018 seasons he has averaged about 133 innings with a 3.49 ERA, 1.11 WHIP and 158 strikeouts. On a per start basis, he has been a top 30 starting pitcher. Last year in NFBC drafts he was the 45th pitcher taken (which I felt was about right at the time).

For the past three years I would project how many innings Hill is most likely to pitch and then add the innings of a replacement level pitcher. For 2019 (and this year) that player was Jake Junis. (Replacement level is defined by a quality pitcher who should easily available on the waiver wire in a 12-team mixed league.)

The reason why I added replacement level innings is I want the rate statistics to comparable to all the other starting pitchers. If I project 80 innings and 96 strikeouts for Hill his value will be depressed against someone who’s projected to throw 170 innings.

I’ve thought about projecting what would Hill do if he threw 170 innings and then defining his value in-draft, but that process seems too subjective. But let’s take a look and see how Hill projects using both projection methods.

The Twins are paying him $3 million but he could make $9.5 million more if he makes 15 starts and/or throws 75 innings. Hill underwent elbow surgery to “primarily repair” a partial tear of the ulnar collateral ligament that he sustained in 2011. He is expected to return in June.

The contract terms signify the Twins are reasonably expecting roughly 15 starts, I’m going to back their play and project 15 starts (80 innings). Below is my projection:

Screen Shot 2020-01-01 at 4.03.41 PM

Maybe I’m overly optimistic about the wins because he only averages about 5 innings per start, but the Twins should have a really good offense. However, you feel about my projections I think it is a fair projection but feel free to use your own numbers.

The question is should I project his totals as if he pitched a full season or should I add a replacement level pitcher? Let’s take a look between the two projections (below):

Screen Shot 2020-01-01 at 4.14.45 PMAs you can see the projections are wildly different. A full season from Hill projects him to be my 27th rated starting pitcher, but when I add replacement level statistics to his base rate, he becomes my 68th rated starting pitcher.

The question where should he be drafted in 12-team mixed leagues? There are two conflicting scenarios where you could take him. One being that you have three solid pitchers on your roster and you can take a risk on him; this would be a low-risk, high upside play. The other being your pitching staff is light and you need to hit a home run with pitching later in the draft; this would be a high-risk, high upside play.

If you’re playing in NFBC the bench spot isn’t as big of a deal compared to other sites like ESPN or Yahoo. I personally don’t like having players like Hill because A) I don’t know when he’s going to pitch, if at all. B) I rather have players have high upside players who don’t currently have an everyday job but could play every day sooner rather than later.

Also, it’s possible some of Hill’s starts come in situations you don’t want to start him. For example, in Yankee Stadium. If I owned him, I would feel compelled to use him despite the poor projection for that start because I would feel like I have to use him when he’s healthy. In other words, I would feel like I have to start him because I had him on my bench for three months.

I still prefer creating projections based on the expected statistics of players and then adding replacement level statistics. In regards to Hill’s fantasy value. His value depends on what type of fantasy owner you are. If you don’t mind having a high upside pitcher who sits on your bench for three months AND he can be drafted at a reasonable price, then go for it. I personally will only look at Hill if he falls to the bottom 70’s among starting pitchers.


Posted in Fantasy Baseball | Leave a comment

