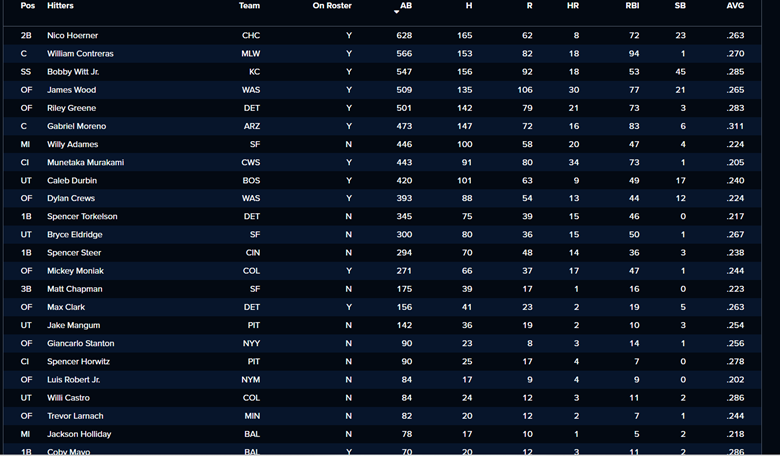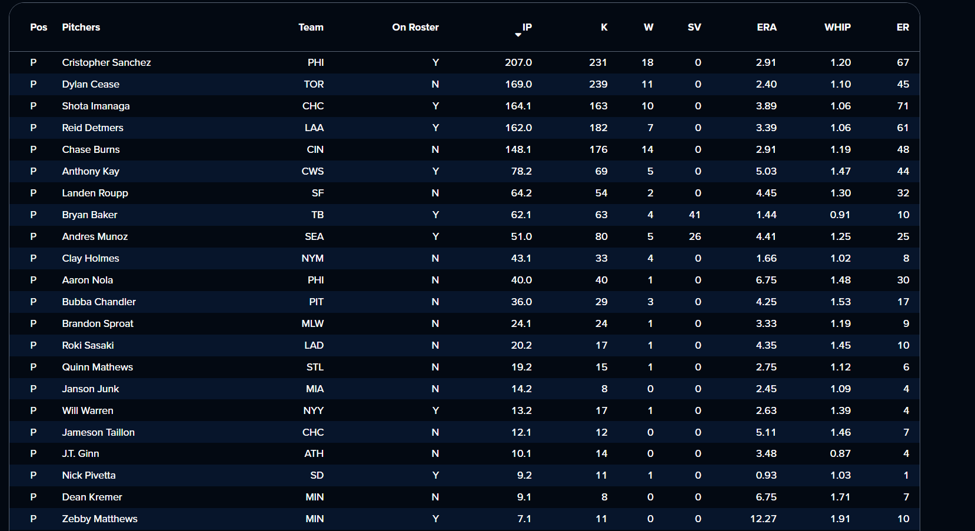
The original analysis of the draft can be found here.
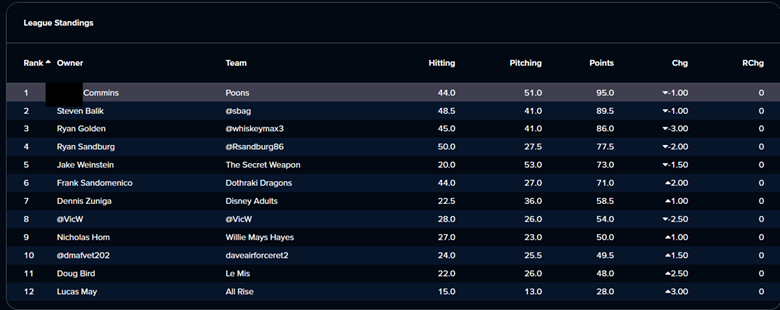
Below are the standings:
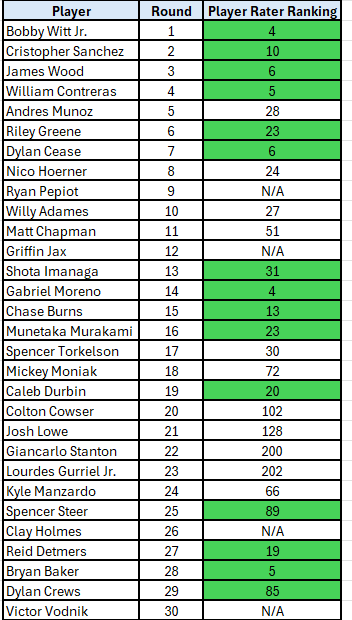
The image below shows my draft picks and where they finished the year at their primary position. The cells in green are the players I made a meaningful profit from. Murakami had to be counted at first base but he played third base for me all year.
Analysis
According to my rough estimates I only made a meaningful profit on 15 (50%) of my picks. You may think I didn’t make a profit with Witt but the fact he provided very good value. When drafting in the top 3-4 rounds protecting the downside is more important than upside. The fact he missed 20 games and still finished 32nd overall is a profit.
The biggest stand out is raking in huge gains with Detmers, Baker and Burns. I remember in the draft I didn’t want Burns but he fell 20-40 picks below his ADP and I modified my plan and selected him.
In the preseason I projected Moreno to hit .281 with 16 homers and 75 RBI and 70 runs and 2 SB. He basically did exactly that but with 30 points more in the batting average. Sometimes you get lucky. He probably hits .285 next year but people will draft him thinking he’s a .295 hitter.
Wood was my 21st hitter overall but his ADP had him 38th. There was batting average risk but his hard hit rates were elite and he was hitting in a very good lineup. The biggest question is will he steal 20 bases again. I’ll probably hedge and project 15.
Every time I try to find cheap power it rarely works out. For cheap power I liked Spencer Torkelson, Munetaka Murakami, Willy Adames, Jake Burger, Kyle Manzardo, Daulton Varsho, Jac Caglianone, Matt Chapman and Ezequiel Tovar. Of the nine players only two delivered.
Random note: Chandler Simpson finished the year as the 21st outfielder but did he really provide 21st value? I would say because a team would have had to have two 40-home run hitters to augment the zero home runs.
Appendix: Additional Player Statistics