League Background
This is a 12-team mixed NFBC draft. The roster consists of 14 hitters, nine pitchers and seven bench players. You set your pitchers once a week; hitters are set twice a week; waivers occur once a week.
Overall Thoughts
This is the first of three drafts. I had the third overall pick which was great because I was guaranteed to get Corbin Caroll or Bobby Witt. I wish I could take some individual picks back but overall I am satisfied with my team. My benchmarks for hitting was a .263 batting average with 324 home runs and 198 stolen bases. My pitching has a high WHIP but hopefully I can stream my pitchers to mitigate it.
With my draft prep I noticed stolen bases were more difficult to find at the end of drafts which is why I prioritized getting stolen bases with my early picks.
My Team
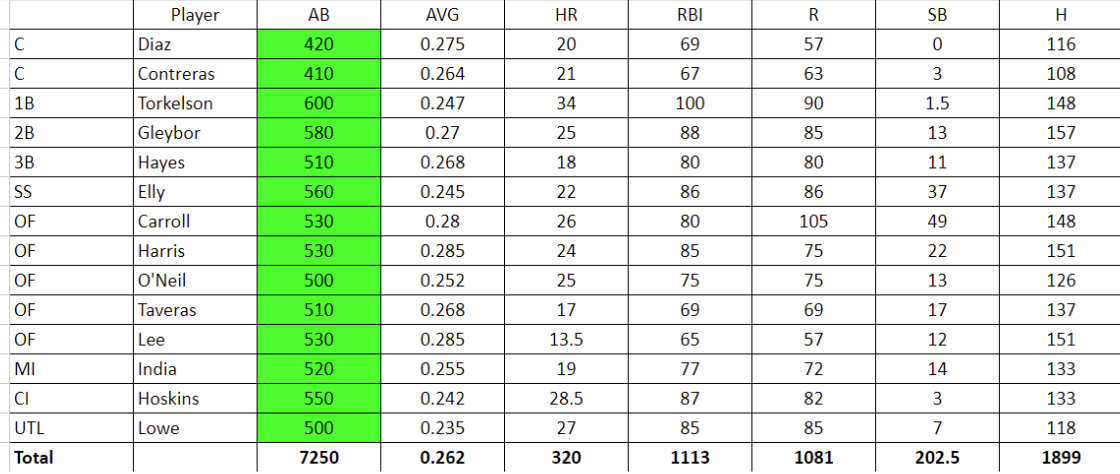
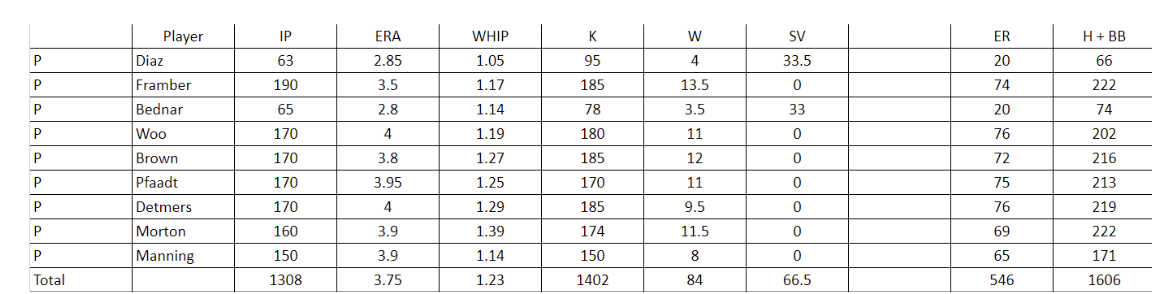
Below is my team with my projections; not listed are my bench players but they will be discussed below the images:
League Background
This is a 12-team mixed NFBC draft. The roster consists of 14 hitters, nine pitchers and seven bench players. You set your pitchers once a week; hitters are set twice a week; waivers occur once a week.
Overall Thoughts
This is the first of three drafts. I had the third overall pick which was great because I was guaranteed to get Corbin Caroll or Bobby Witt. I wish I could take some individual picks back but overall I am satisfied with my team. My benchmarks for hitting was a .263 batting average with 324 home runs and 198 stolen bases. My pitching has a high WHIP but hopefully I can stream my pitchers to mitigate it.
With my draft prep I noticed stolen bases were more difficult to find at the end of drafts which is why I prioritized getting stolen bases with my early picks.
My Team
Below is my team with my projections; not listed are my bench players but they will be discussed below the images:
Individual Player Analysis
Corbin Carroll (#3) – I’ve been a believer in Carroll for almost two years now. Last year I drafted Carroll last year in the fifth round. Like I mentioned earlier it was a toss up between Witt and Carroll. Julio Rodriguez was close but I wanted someone who could go 20/50 compared to 30/30. The biggest worry about Carroll is health; specifically, his shoulder. It seems like he could get hurt at any point because of how much torque he puts into his swing.
Elly De La Cruz (#22) – I normally take boring, low variance players in the 2nd and 3rd round but I couldn’t help but take a shot on another 20/50 upside player. Most fantasy experts believe his projections (.245 with 22 home runs and 35 stolen bases) is a hedge in that he either exceeds his projections or dramatically underperforms. I agree with the thesis. What put me over the edge on drafting him was the injury to TJ Friedl. If Elly has a slow start he’s not getting sent to the minors; the Reds will allow him to figure it out. Before the Friedl injury and Noelvi Marte suspension it was conceivable the Res would send Elly to the minors if he started slow but not anymore. Elly is vastly superior to any replacement the Reds have.
Michael Harris (#27) – It was between Harris and Luis Robert. I went with Harris because I wanted a safer batting average anchor to counterbalance the Elly pick. His career statistics indicate he’s pretty safe for batting average but there are flaws with approach. Last year he did a lot of damage by swinging early in counts. However, he’s hitting more fly balls and for harder contact…and to top it off he’s still only 23 years old.
Edwin Diaz (#46) – Diaz is the best closer in baseball…or at least on my board. His year-by-year output is high variance but when he’s at his best, he’s better than everyone. I debated getting a starting pitcher in the 3rd round but the best value was Diaz. The next best pitcher was Framber Valdez, which I got with my next pick. I drafted Diaz ahead of Valdez because Valdez’s ADP was much higher than Diaz’s and the two owners behind me already had starting pitchers which lowered the probability they would draft Valdez.
Framber Valdez (#51) – Valdez was the ninth best pitcher on my board. I knew if I was going to draft Diaz in the 4th I wanted an innings eater who could give me wins. In the past two years I’ve noticed my pitching staffs were consistently lacking in wins. I think that is due to me liking good pitchers on bad teams, which is probably why they’re value picks in drafts. The Astros probably have the best one or two bullpens in the Majors so if Valdez makes 31 starts I’m hoping for 14-15 wins.
Gleybor Torres (#70) – I have no idea why Torres is going so late in drafts. He provides statistics in every category, is 27 years old and is in the last year before hitting free agency. Is it possible he goes 30/20? It’s very possible. If he plays 140 games, 25/15 seems like his floor.
David Bednar (#75) – Bednar hasn’t pitched in Spring Training but it seems like he’s on pace to be ready for Opening Day. He’s my fifth closer. I’m not worried about him getting traded and becoming a set-up guy. If he gets traded I think he’ll still be the closer. I also think the Pirates could win 82-86 games this year.
Yainer Diaz (#94) and Wilson Contreras (#99) – I think both players hit 20 home runs, play every day, bat in prime spots in the lineup and will have batting averages that won’t hurt me. Last year Contreras had 30 games at DH. Does that repeat this year? Probably not, but I think his contract and bat means the Cardinals will give him 120 games behind the plate.
Spencer Torkelson (#118) – In the last few seasons I’ve gotten burned by trying to find power in the value bucket. According to StatCast, Torkelson was 17th overall in HardHit%. I had another player pegged at this spot but A) my team was lacking power and B) there weren’t that many legit 40-home run potential corner infielders left. The additions of Parker Meadows and Colt Keith along with a healthy sophomore season from Riley Greene I think it’s possible Torkelson goes 100/100.
Ke’Bryan Hayes (#123) – At this point in the draft I didn’t have a third baseman and I wanted to lock up the position. I’ve owned Hayes the past two seasons because I’ve always been tempted about his potential to hit more home runs due to his high hard hit rate. Last year the hard hit rate and fly ball percentage all increased but his HR/FB rate was only 9.8%. I think he got unlucky with the home runs last year and I think if he just repeats last year he will have 18 home runs.
Bryan Woo (#142) – Woo threw 130 innings last year which means I think he could throw 160-170 innings. I love his home ballpark and division. He’s in the low 100’s on Stuff+, Location+ and Pitching+.
Hunter Brown (#147) – I actually liked Brown more than Woo but Woo had a lower ADP. As I mentioned about Framber Valdez, I’m hoping for above average wins. Like Woo, Brown is in the low 100’s on Stuff+, Location+ and Pitching+. I think Brown got very unlucky last year. I can see a season with a 3.50 ERA with more than a strikeout per inning.
Rhys Hoskins (#166) – I’m hoping for 30 home runs with a .245 batting average. The Brewers are lacking offense; combine that with his contract I think Hoksins plays every day in the cleanup spot.
Jonathan India (#171) – Like I mentioned about Elly De La Cruz, with all the injuries India is going to play every day. With the injury to Matt McLain it looks as though India will leadoff all the time and if not he almost certainly will leadoff against left handed pitching.
Brandon Pfaadt (#190) – I really liked what I saw at the end of the season and playoffs.
Tyler O’Neil (#195) – I was a big believer in O’Neil last year. I love the raw skills and he’s finally out of St. Louis. I love his home ballpark and he’s in his walk year. Three years ago, in his only fully healthy year, he hit 34 home runs with 15 stolen bases.
Leody Taveras (#214) – He’s in a good lineup and his defense will allow him to play every day…which if happens he’s a 15/15 player.
Reid Detmers (#219) – Detmers is very close to 100’s for all three: Stuff+, Location+ and Pitching+. I like the home ballpark and the ballparks in his division. Strikeout rate jumped up last year where he struck out more than a batter per inning.
Jung Hoo Lee (#238) – I wanted Steven Kwan at this spot but I settled for Lee because I wanted his batting average. I don’t have an opinion about his output but the projections think he will hit .285-plus.
Ceddanne Rafaela (#262) – He’s the best defender in center for Boston and I think he’s the everyday center fielder. If he plays 140 games I think he could steal 30 bases. He’s also a hedge if O’Neil gets hurt.
Charlie Morton (#267) – Morton will be a streamer for me. I think he can still get a lot of strikeouts. The biggest issue is what will his WHIP be?
Jeff McNeil (#286) – I drafted him as Lee insurance. I projected both players to hit .285 with 12/12.
Ranger Suarez (#291) – I don’t like his stuff and I think there’s a slight regression in the strikeout rate. He’s a streamer for me.
Matt Manning (#310) – His velocity is up this spring and he is striking out 33% hitters. If throws 150 innings with a 22% strikeout rate, Manning is a borderline top 50 starting pitcher.
Vaugh Grissom (#315) – I wanted a backup shortstop and he was the best left.
Jameson Taillon (#334) – I think he was extremely unlucky last year. Two years ago he had a 3.91 ERA and 1.13 WHIP. The Cubs gave him $68 million over four years. I don’t think he’s nearly as bad as his 2023 numbers.
Giovanny Gallegos (#339) – He’s Ryan Helsley insurance.
Tyler Black (#358) – I’m hoping the Brewers let him play second base. They desperately need offense and Black provides that offense. Black is probably getting dropped on my first waiver week.